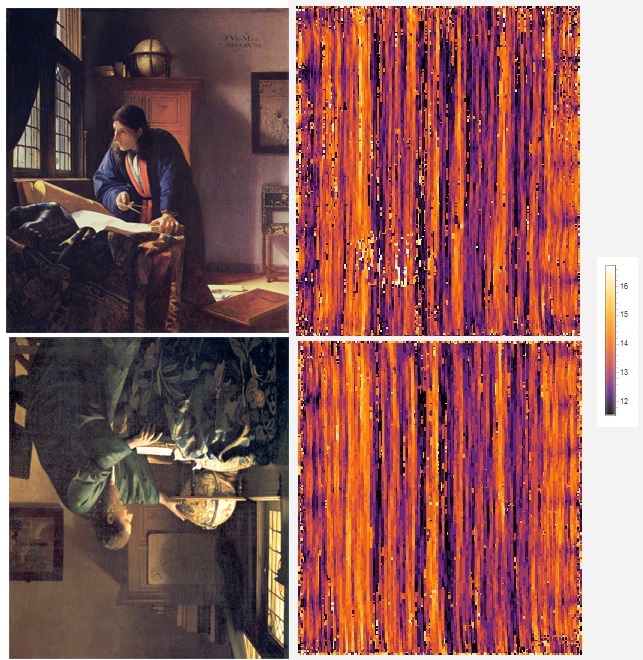
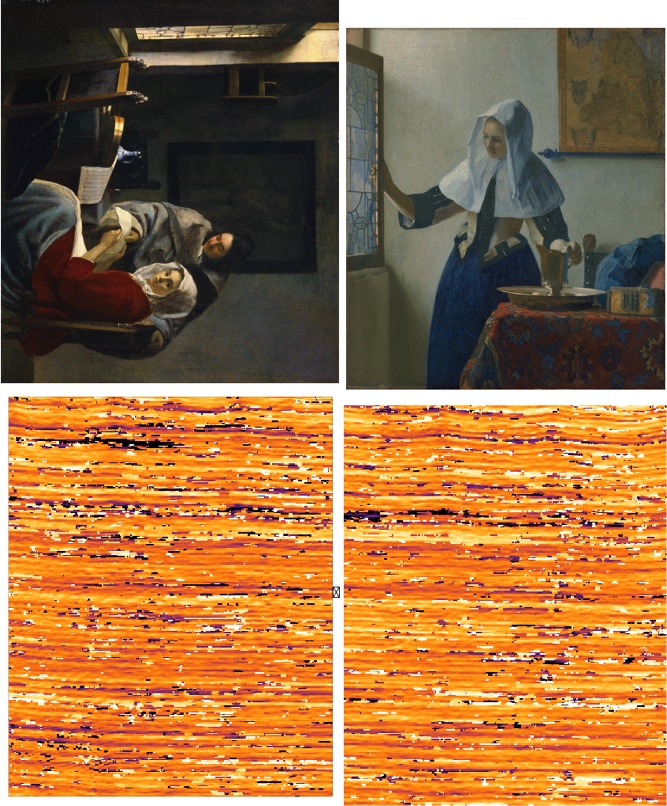
Figure 1: Johannes Vermeer, The Geographer (top), ca. 1668–1669, Oil on canvas, 53 x 46.6 cm. Städelsches Kunstinstitut und Städtische Galerien, Frankfurt am Main and Johannes Vermeer, The Astronomer (bottom, rotated 180◦), ca. 1668, Oil on canvas, 50 x 45 cm. Musée du Louvre, Paris (artwork from Wikimedia Commons), and corresponding vertical weave maps (at right). Each pixel in the weave map represents the value of a thread count at a single evaluation point, which is carried out automatically over the complete canvas. To convert the similarity assessment into a visual task, the density values for each evaluation tile are transformed into colored squares that indicate the densities of the vertical threads. The immediately obvious defining feature in these two maps is the pattern of stripes. As this pattern is the result of the manufacturing process, it will be shared by bolt mates. This match was first presented in “Canvas Weave Match Supports Designation of Vermeer’s Geographer and Astronomer as a Pendant Pair” (Johnson and Sethares 2016).
Background
In March 2006, Ella Hendricks, head of painting conservation at the Van Gogh Museum, agreed to tutor Rick Johnson (the first author of this article) in the activities of a conservator with the goal of expanding the use of computer-based tools in painting analysis. At the time, thread counting was typically accomplished using x-radiograph film of a canvas posted on a light box and measured with a magnifying headset. After shadowing the department for fifteen months, the author recognized that thread counting could serve as a candidate for automated analysis via Fourier methods. Fourier analysis is a common tool taught to undergraduate electrical engineers that is useful for estimating the periodic components in a signal. In the thread counting application, the “signal” is the greyscale intensity fluctuations visible in the x-radiograph corresponding to the threads. Once the potential of Fourier analysis to automate canvas thread counting was confirmed, the Thread Count Automation Project (TCAP) was formed in 2007 to coordinate teams of experts in digital signal processing. The teams tested a variety of procedures and a variety of ways of presenting the results. One fruitful method visualizes the thread count data over a complete canvas using color to represent the varying thread densities. The resulting weave maps (such as in Figure 1) are often striped, and offer a detailed view of the small variations in the density pattern of the weave. These variations often extend over the width and breadth of the roll originally containing the canvas. A weave match occurs when the weave maps from two different canvases have the same pattern of stripes. This has become compelling forensic evidence in establishing rollmate status between two separate canvases.
When combined with information about a painter’s studio practice, material data (e.g. the range of ground layer materials used by the artist), and documentation (e.g. in letters, financial transactions, and memoirs), canvas weave matches can assist in authentication, dating, and inference of artist’s intent, as Liedtke, Johnson, and Johnson recognized in 2012 for paintings by Vermeer. That same year, document-rich studies incorporating weave matches appeared of paintings by Vincent van Gogh (Tilborgh et al. 2012) and Diego Velázquez (Pérez d’Ors, Johnson, and Johnson 2012). In the case of Vermeer, for whom substantial studio documentation is lacking, the eight weave match pairs discovered so far (Johnson Counting 2017) from among Vermeer’s thirty-four paintings on canvas (Liedtke 2008) potentially offer additional insight into unanswered questions, in particular those regarding dating. When a weave match is made between canvases that stylistic analysis dates as several years apart, this can challenge the prevailing sense that an artist would be unlikely to hoard canvas for a long period. Assembling a weave match study across the entire oeuvre of a painter can provide valuable data regarding chronology. A comparison of weave maps for paintings by different artists from the same period and place could help to establish patterns of interaction among the artists.
In the decade since the creation of the first automated thread counting procedures, researchers have used weave maps of thread density and angle to analyze Old Master European paintings from the fifteenth to the early twentieth centuries. Striped weave maps have also been produced for twelfth and thirteenth-century Chinese silk painting supports. The extension to other fabrics with periodic weave patterns can be envisioned as long as they can be imaged with resolution sufficient for a human to count the threads, this might include clothing, flags, and other woven cultural heritage objects. Thus, this decade-long project to develop procedures that use tools from digital signal processing as aids to art historical analysis of paintings on fabric demonstrates the potentials of technology and the trans-disciplinary collaboration between art historians, signal processing engineers, and the institutions that provide the support and data that enable collaborations. The objective of the present paper is to document the procedure employed in the study of Vermeer’s canvases (Johnson Counting 2017) as it advances from scanned x-radiographs, through weave maps, and onto the hunt for weave matches. The audience for this document is presumed to be the end users of the weave match reports; no knowledge of digital signal processing or computer programming is presumed, and therefore, mathematical language is avoided.
A Procedure for Finding Weave Matches
Hunting for Weave Matches presents the complete procedure for comparing possible weave matches and attempting to locate matched pairs. The procedure is accomplished in several stages. First, it is necessary to gather appropriate x-radiographs and transform them into digitized form. Second, manual thread counting is needed both to provide a ground truth and to initialize the computer methods. Third, computer methods draw the weave maps of the individual canvases. Fourth, the weave maps must be compared to each other, and plausible matches detected. Finally, possible matches must be studied by referring back to the x-ray images, to the paintings, and to the incorporation of art historical knowledge. Though it may not be immediately obvious, many of these steps require interaction between the eye of the conservator (or art historian) and the computational algorithm, between the expert and the machine.
The success of the automated thread counting project provides an example of collaboration between art history and computational science where software tools were developed to target a basic problem of interest to art historians and conservators. The human expert is an inherent part of the decision process and a crucial participant in the application of such tools. In the creation of Counting Vermeer (Johnson 2017), x-radiographs providing full-painting coverage of all thirty-four of Vermeer’s works on canvas were digitized, stitched, hand counted, weave mapped, and compared. In documenting the result of the interactions between art historians and signal processing engineers over the course of the Counting Vermeer project, and by formalizing the procedures developed in this collaboration, this paper hopes to show how such interactions can be mutually beneficial.
Compiling a formalized procedure may appear somewhat pedantic; after all, given software for drawing weave maps, what else needs to be done but to press the “run” button? There are several issues, however. First, how is the basic data to be gathered? For example, if an x-ray is scanned at too low a resolution, the evidence for existing stripes may be ambiguous or lost entirely. Secondly, when conducting the manual count, where and how many locations should be counted? Finally, when comparing weave maps, how should stripes be assessed as aligned and a match declared? By following the procedure outlined in this paper, and diagrammed as a “flow chart” in Figure 2, it is possible to carry out the procedure in a reproducible manner. This does not mean that interpretations of weave maps are indisputable; rather, it demonstrates that the basic data on which arguments are based can be re-derived in a systematic manner by any researcher. Yet the interpretation of that data will always require an experienced eye.
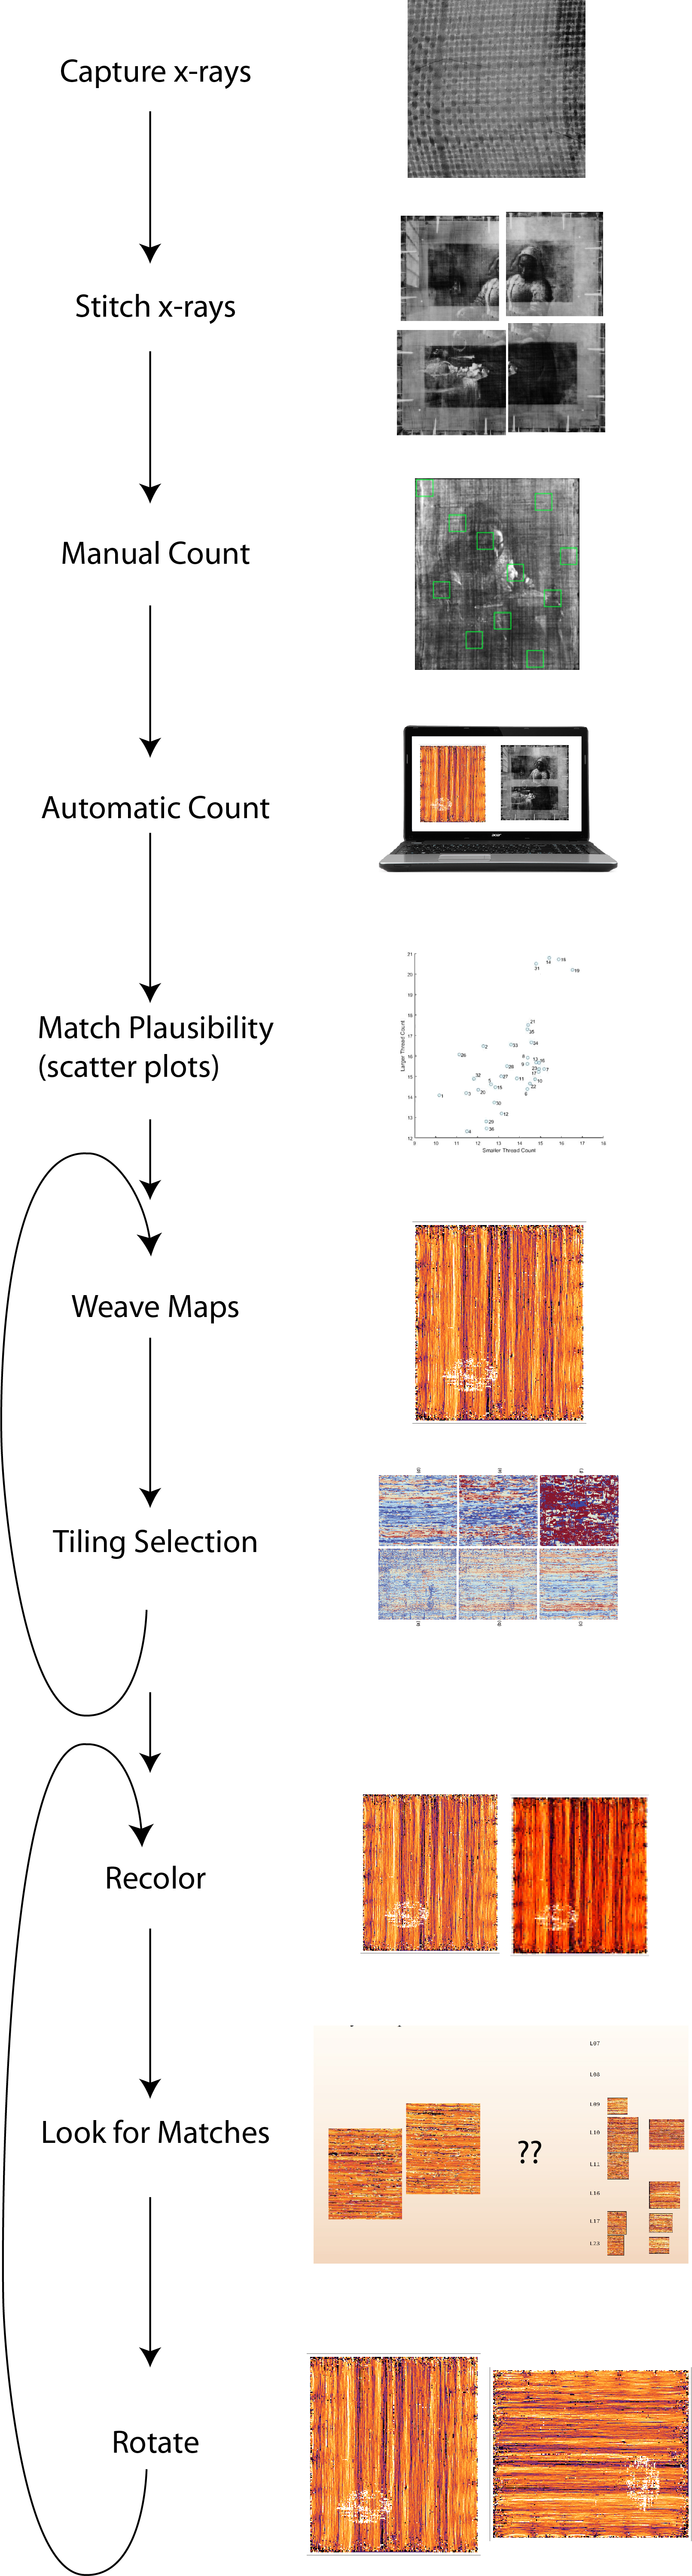
Figure 2: Schematic flow chart of the complete “hunting for weave maps” procedure.
The Hunt
Digitizing
A key parameter in the study of digital x-radiographs is the size of each pixel, which is typically specified in terms of dots per inch and abbreviated dpi.
Step 1: For all canvases to be studied and compared, obtain x-radiographs digitized (scanned) at sufficiently high resolution. Ten dots (pixels) per thread is the recommended resolution.
For 10 dots per thread, the dpi is 25.4 times the thread count in threads per centimeter (th/cm). For canvas with a thread count of 12 th/cm a dpi of 300 will provide 10 dots per thread. For a thread count of 24 th/cm a resolution of 600 dpi provides 10 dots per thread. Fewer than 10 dots per thread can sometimes provide an adequate image. But fewer than 5 dots per thread typically produces images that are difficult to hand count. A simple rule of thumb is that the chosen resolution needs to be high enough to make manual thread counting feasible.
Stitching
When the canvas is too large to be covered by a single x-radiograph, it is necessary to take multiple images.
Step 2: Construct a composite of the full painting with the constituent digitized x-radiographs using computational stitching.
In order to reassemble these segments, some overlap is necessary (at least 10%) between all adjacent x-radiographs. The re-assembly process can be done in two different ways. The weave maps can be calculated first and then a drawing program (such as Photoshop) can be used to align the stripes in the constituent images, or a stitching algorithm can be used to reconstruct a full x-radiograph, from which the weave map is then calculated (Johnson, Erdmann, and Johnson 2011; Conover, Delaney, and Loew 2013). Since the stitching process is somewhat complicated, there is the possibility that a discontinuity in the stitching may introduce artifacts into the weave maps (for example, a feature may be distorted or may appear doubled). For smaller canvases where a single x-radiograph can cover the complete canvas, skip this step.
Manual Thread Counting
Given the repetitive nature of the thread counting task, it is tempting to delegate all the tedious tasks to the computer. However, there are two good reasons to conduct an initial manual count. The first is that computer-based calculations of “thread count” do not literally count individual threads the way a person might. Rather, they carry out a numerical procedure whose result closely approximates the thread count (Sethares “Automated” 2017). The second reason to conduct manually-assisted thread counts is that all current software methods for thread counting need to be initialized or trained. For example, the Fourier method (Sethares “Automated” 2017) needs to be told “approximately” what the thread count is, and it can then quite reliably fine-tune this answer. Yet if the initial guess the software is given is far from the correct value, then the resulting computed result may well also be incorrect. Thus, a manual thread count is needed to ensure that the computer-generated counts are plausible.
Step 3: For each canvas, perform a manual thread count in several (5 to 15 are suggested) patches (1 to 2 cm squares are suggested) across the painting (with no two counting the same threads as they continue through the painting canvas) of threads in both the horizontal and vertical directions (relative to the painting orientation). Software is available to assist and document this manual thread counting (Sethares “Computer-Assisted” 2017).
Automated Counting
Weave maps compute “thread counts” in square tiles of size x by x centered on a grid of points that are the same distance d apart in the vertical and horizontal directions. The separation should be no larger than the edge length of the square evaluation tiles. For example, it is common to maintain a simple integer relationship x = n d between x and d where n = 1, 2, 3, or 4. Typical choices for x range from 0.5 to 2 cm. Since radiographs are in one to one correspondence with the canvas, these blocks can be visually mapped directly onto the canvas.
Step 4: For a suitable range of values of x (e.g. 0.5, 1.0, 1.5, and 2 cm) and a suitable range of values for d (e.g. 1, 2, 3, and 4) compute the thread counts in tiles covering the composite x-radiograph.
Counting software using Fourier spectral analysis is available (Sethares “Computer-Assisted” 2017). The details of extracting accurate thread counts from peaks in the spectrum depend on the weave type, e.g. simple (also known as tabby) and twill (Johnson, Johnson, and Erdmann 2013). Most Old Master paintings are on simple weave canvas. This spectral method works well in approximating the thread count only if the threads are sufficiently regularly spaced. If the spacing is too irregular and not approximately periodic, the spectral information, while no longer necessarily providing a close match to the actual thread count, can still be used as an image feature allowing weave comparison.
Match Plausibility via Scatter Plot
If the average counts in two paintings of these manual thread counts are too different, i.e. they differ by more than 2 th/cm in both directions, then they cannot be rollmates and continuing to draw weave maps is unnecessary if the only issue to be determined is if they are rollmates. One way to organize the data from a large number of paintings is to draw a scatter plot as in Figure 3. This shows all the computed counts in both directions for all thirty-four Vermeer paintings on canvas, labeled by L number (Liedtke 2008). Canvases that are far apart need not be considered for possible matching. On the other hand, canvases that are nearby in the scatter plot deserve further consideration.
Step 5: Given the computed thread count averages (both horizontal and vertical directions) for each canvas under examination, draw the scatter plot by plotting the smallest value on the horizontal axis and the largest value on the vertical axis.

Figure 3: Scatter plot of average thread counts. Each small circle plots the thread count (smaller direction vs. larger direction) and are labelled with the adjacent L numbers. Tight count matches of a specific painting are within a 2 cm square box centered on coordinates of a given painting.
Weave Maps
Step 6: For each painting under examination, map the thread count values into a color image using a colorbar to associate the numbers to colors. Construct one weave map for the horizontal threads and another for the vertical threads.
Software for converting the computed thread counts from each tile into weave maps is available (Sethares “Automated” 2017). The average of the computed thread counts in one thread direction should be used as the center of the colorbar for the corresponding weave map. The range of the colorbar should extend from 3 th/cm below the center value of the color bar to 3 th/cm above it. (These numerical suggestions are for the typical canvas thread counts of fifteenth to early twentieth-century European canvases, which typically range from around 6 th/cm up to the low 20s.) The weave map puts the color for the computed thread count value for each evaluation tile in a d by d sized square centered on the point on which the evaluation tile is centered.
Tiling Selection to Reveal Stripes
If the square evaluation tile side dimension x is too small (which is relative to the degree of count variability across the painting), a weave map will appear random (e.g. speckled, without stripes) and will not be useful for weave matching. If x is too large, the weave map will have a blob-like appearance with no apparent stripes. This is illustrated in Figure 4, which shows a single canvas analyzed with a variety of x and d values.
Step 7: Examine the resulting weave maps for various x and d. Select an x and a d that allow the weave maps of each canvas being counted to exhibit stripes in both of its two thread directions, if possible.
Sometimes the x-radiograph image can be of such poor quality that stripes appear in only one weave map direction— horizontal (H) or vertical (V)—no matter how x and d are chosen. The weave match hunting procedure can continue in such a case but this limits the matching test orientation options.
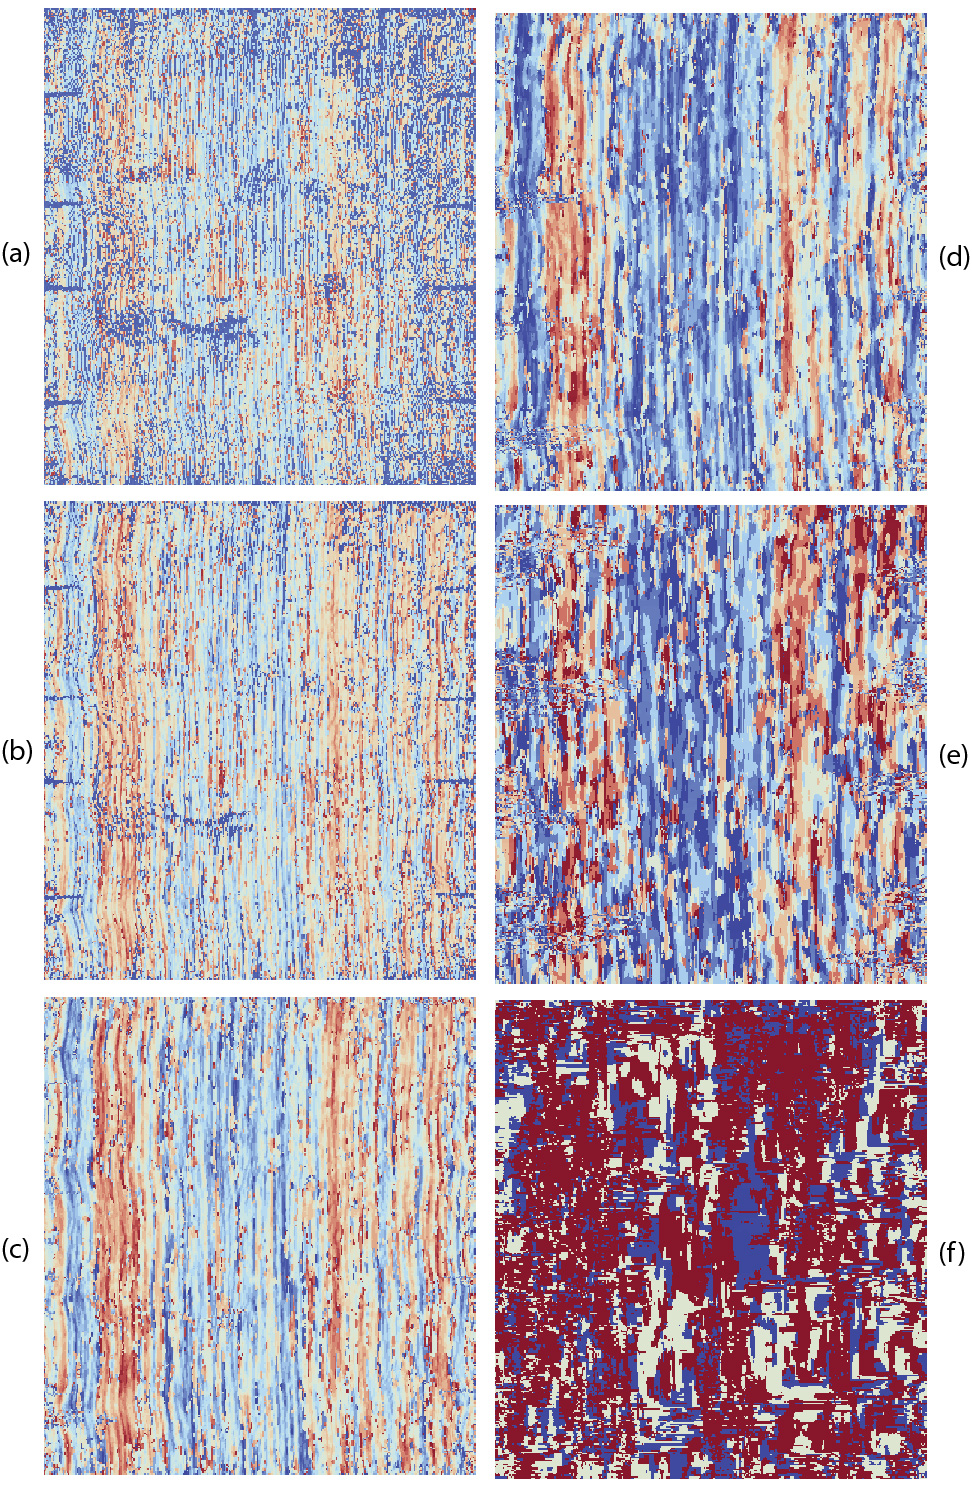
Figure 4: Using different-sized regions (parameter d) examine the canvas at different scales (parameter x) and can lead to different results for thread density maps. Weave maps drawn in various color schemes display the same information, but the stripes may be easier to see in some color schemes.
Re-Coloring the Weave Maps
When comparing any two (or more) weave maps, it is necessary that they be plotted with the same color bars. This is one of the reasons why the weave-map data must be maintained in numerical form (rather than as static jpeg images, for instance).
Step 8: For the x and d chosen in the previous step (that cause stripes to appear in at least one of the two weave maps—with one of horizontal threads and the other of the vertical threads—of each canvas) use the same color bar to compose weave maps drawn to the same scale for all of the paintings to be compared for possible weave matches.
The color bar should be centered on a value that is near either the horizontal (H) or vertical (V) average count of the two canvases. If one canvas is to be compared to multiple canvases with which it has a count match, i.e. in one comparison of H to H and V to V or H to V and V to H the average thread counts computed across the entire images are close to one another, the average H and V thread counts of the one canvas to be compared to several others should be used as color bar centers. Weave maps to the same physical scale should have the same relative sizes as the (composite) x-radiographs of the canvases.
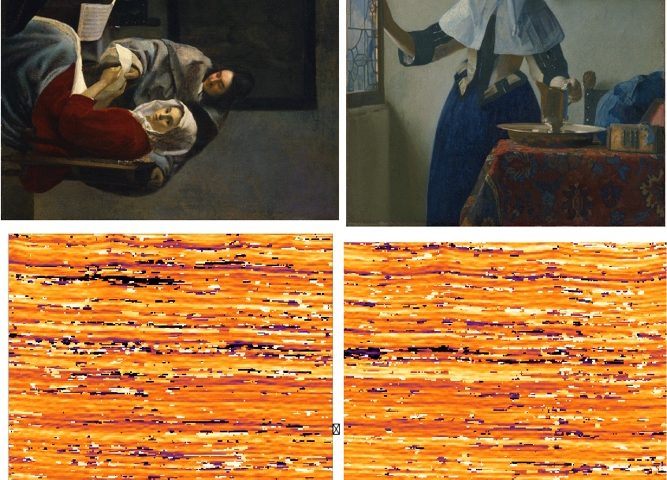
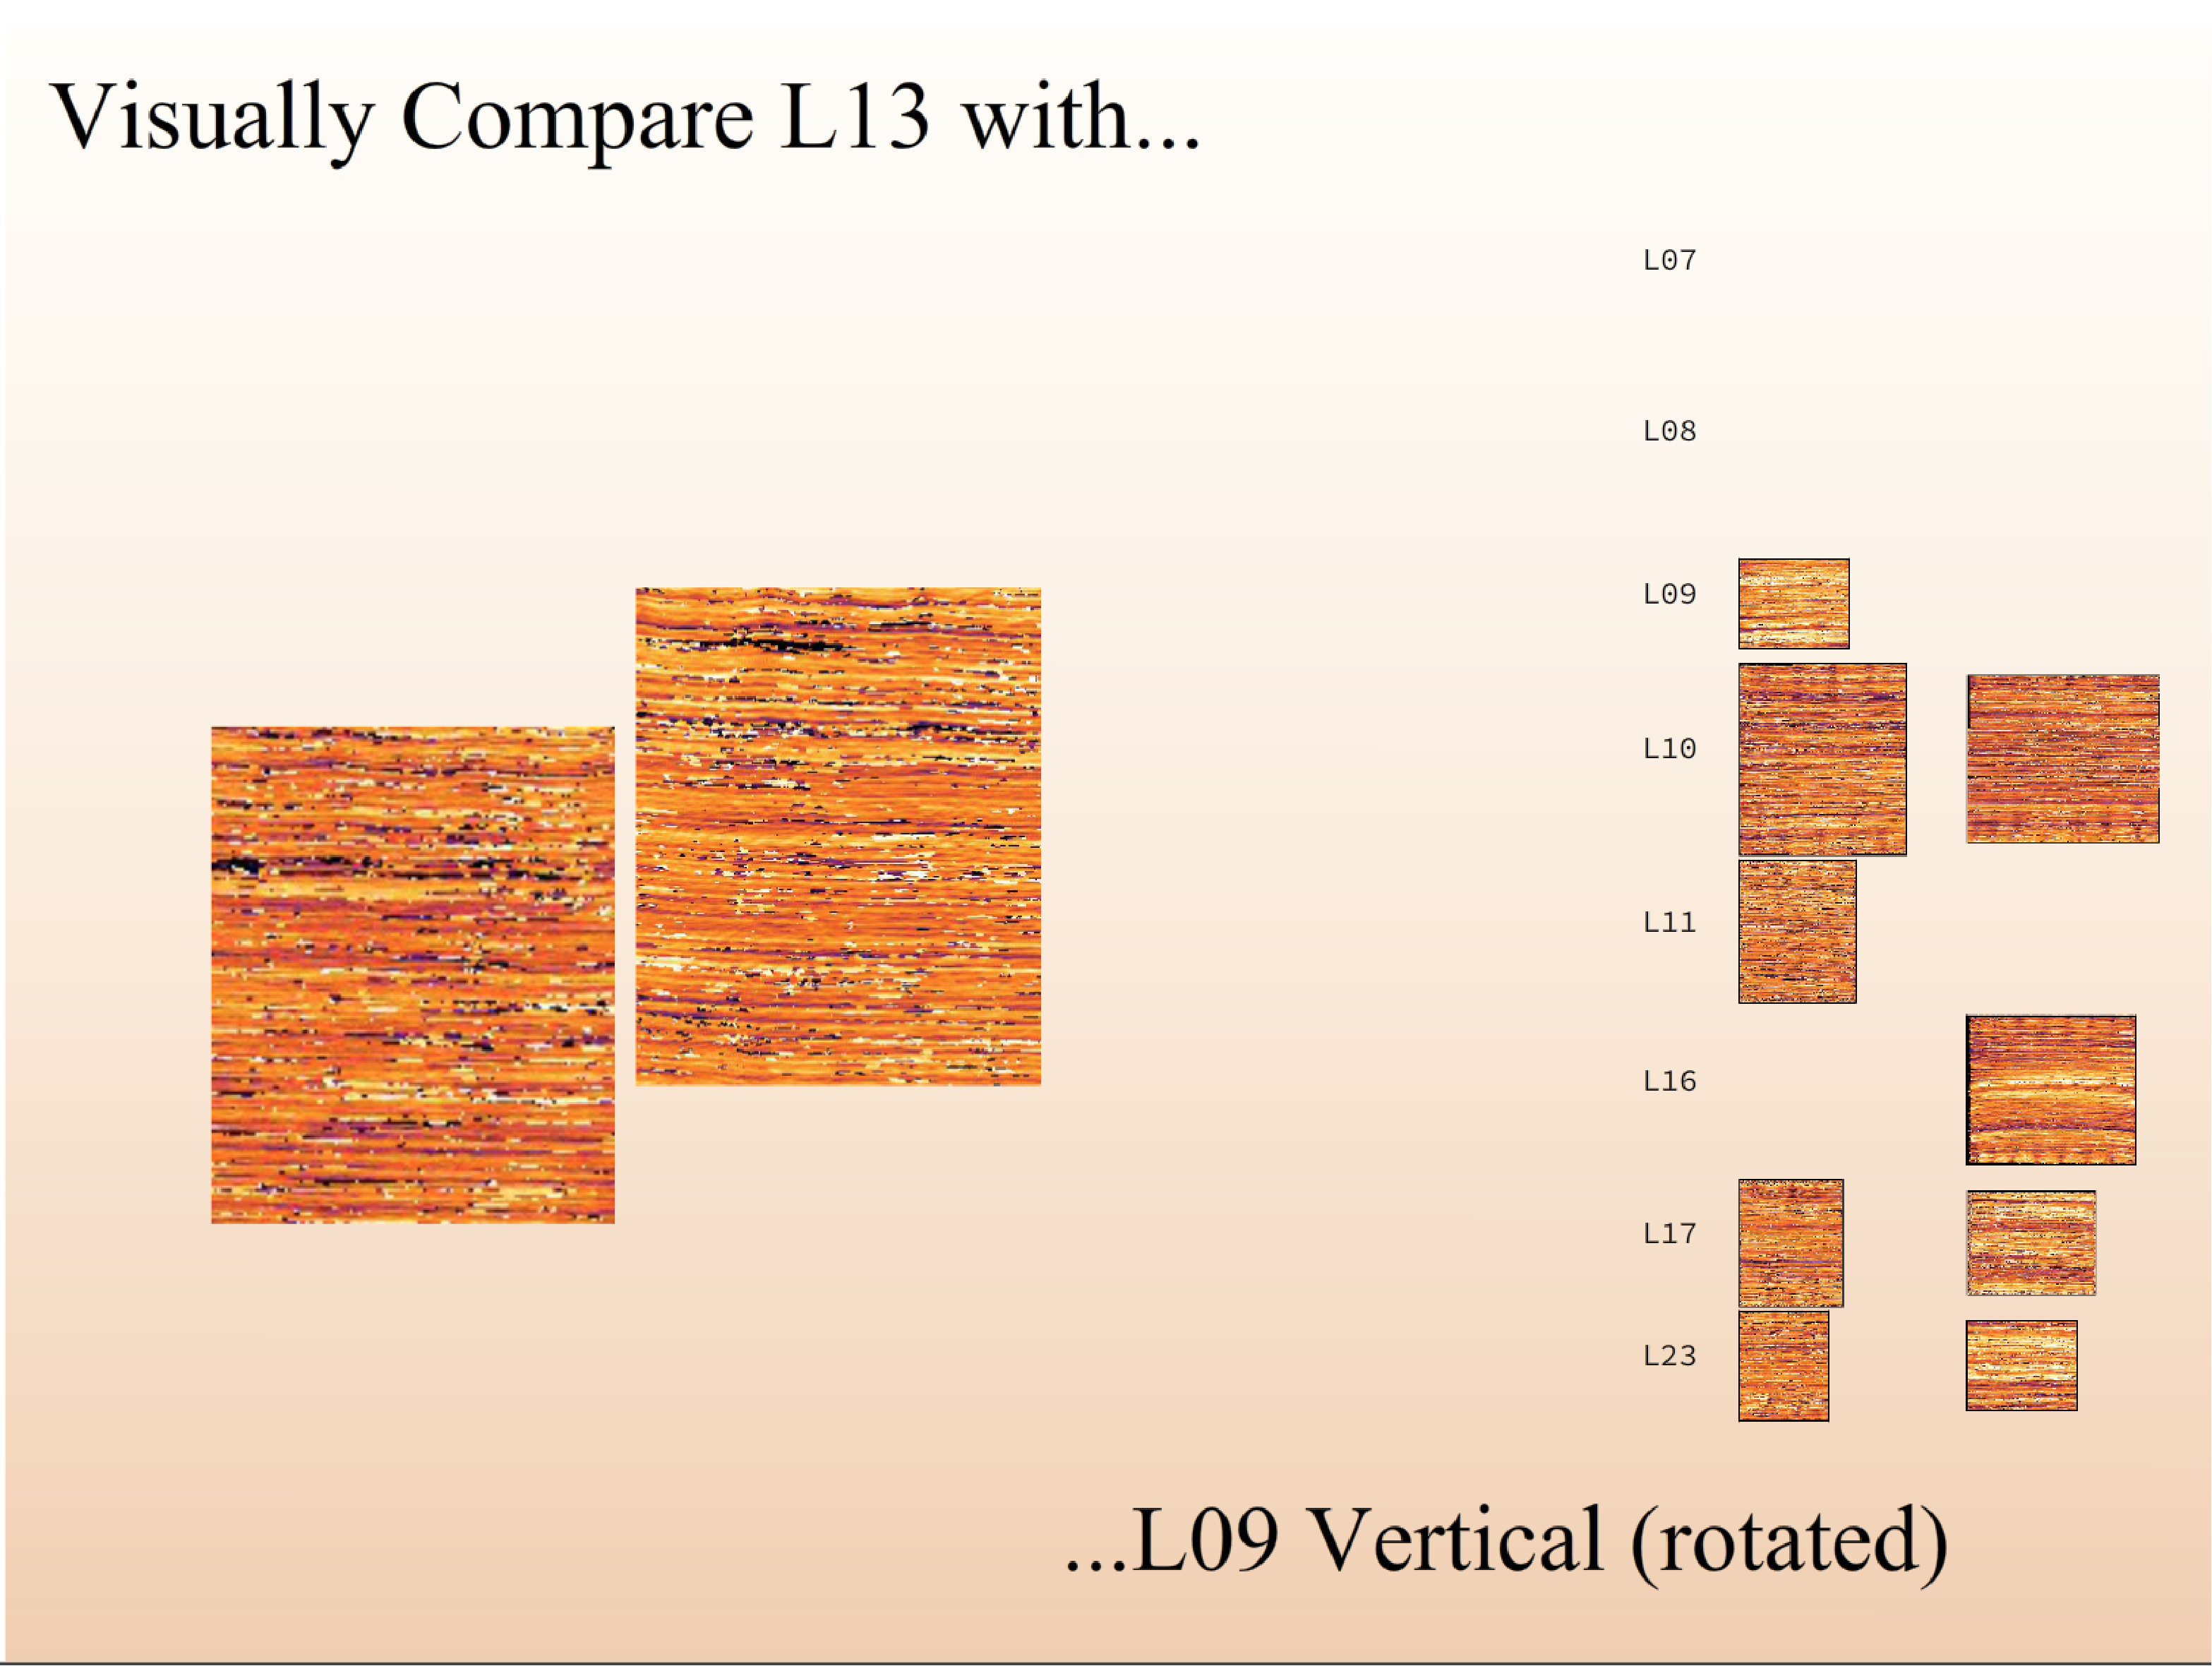
This process is illustrated in the accompanying video demonstration (at about 40 seconds, when the title is “Visually compare L13 with”). Subtle recoloring of the weave maps, originally colored about their individual average counts, occurs when they are collated to compare with L13. The group of paintings chosen for comparison to L13 have average counts within 1 th/cm of each other in both directions. Such “tight” count matches, within 1 th/cm in both directions for a H to H and V to V or H to V and V to H comparison, were chosen because the first six weave matches among Vermeer’s paintings on canvas were found to be within this degree of similarity (Johnson “Exploiting” 2017).
'Hunting for Weave Matches: Computation in Art Scholarship' has 1 comment
February 21, 2018 @ 12:06 pm Table of Contents: Issue Twelve /
[…] Hunting for Weave Matches: Computation in Art Scholarship C. Richard Johnson, Jr. and William A. Sethares […]