Incorporating the Virtual into the Physical Classroom: Online Mastery Quizzes as a Blended Assessment Strategy
Kyle Beidler, Chatham University
Lauren Panton, Chatham University
Abstract
An increasing volume of research has supported the assumption that pre-lecture, online, and mastery quizzes can be a beneficial pedagogical strategy. However, there has been limited documentation of attempts to combine these pedagogical tools as an assessment of individual course lectures. This paper presents a “blended” instructional approach, which combines an online mastery quiz format with traditional face-to-face meetings within the context of a small graduate course. Preliminary findings suggest that online mastery quizzes that are incorporated into traditional classroom instruction are a useful means of evaluating weekly course lectures and also provide a catalyst for classroom discussion.
Indexing
Landscape Architecture; Pedagogy; Assessment; Mastery Quizzes
Introduction
Course quizzes represent a common assessment strategy and teaching technique that have been used by instructors for generations. Quiz formats have increasingly varied with the advent of digital technologies. There are now pre-lecture, out-of-class, and mastery quiz formats that have been implemented using both traditional and digital media. In addition to this growing range of quiz typologies, quizzes have produced somewhat mixed findings when studied from an educational perspective.
Paper-based quizzes given at the start of a class period have been used as a means of encouraging students to be both punctual and prepared for scheduled class meetings. Pre-lecture quizzes are also a common tool used to assess the students’ current understanding of the course material. Generally, such quizzes are believed to increase student engagement. However, research findings have varied in terms of student performance.
For example, Narloch and his colleagues found that students who received pre-lecture quizzes, as compared to no quiz, performed better on exam questions (Narloch, Garbin, and Turnage 2006, 111). This study also suggested that simple objective or low-level questions (i.e. fill-in-the-blank, matching) improved student performance on higher-level assessments such as essay questions (ibid., 112). These findings are similar to an additional study that suggested low-level quiz questions can increase student exam performance. However, this same study contradicts the proposed correlation between low-level questions and higher-order cognitive skills such as deductive exploration (Haigh 2007).
In contrast, others have suggested that pre-lecture quizzes do not automatically lead to increases in student performance as indicated by final grades. A comparative study found that exam scores were not significantly improved in sections of a biology course that included weekly quizzes comprised of fill-in-the-blank questions (Haberyan 2003). Connor-Greene found that daily essay quizzes can be a catalyst for thinking within the classroom. However, the author cautioned that the relationship between quizzing and actual learning warrants further study (Connor-Greene 2000).
With the increase of computer technology in higher education, much research has also analyzed the perceived benefits of computerized and online quizzes. Early findings suggested that computerized quizzes can improve exam performance if students used the quizzes to test their knowledge as opposed to learn the material (Brothen and Wambach 2001, 293). Others have suggested that online quizzing is as effective as in-class quizzing only after reducing the possibility of cheating by adjusting the question bank and available time (Daniel and Broida 2004).
Additional studies of online quizzing found that students who elected to use online quizzes performed better in summative exams (Kibble 2007). Kibble’s online quizzes were voluntary, and thus better performing students were more likely to use online quizzes to improve their performance. A later study was able to control for selection bias as well as a number of confounding factors by using retrospective regression methodology. Findings remained consistent with the majority of the literature and suggest that exposure to regular (low-mark) online quizzes has a significant and positive effect on student learning (Angus and Watson 2009, 271).
A study of online, out-of-class quizzes within the context of a small course found that digital quizzing could only be significantly related to student engagement and perceptions toward learning, as opposed to student performance (Urtel et al. 2006). Despite the lack of support regarding academic performance, the authors still concluded that the unintended benefits of the online format outweighed traditional in-class quizzing. This suggests that additional or secondary benefits may alone justify the use of online quizzes within the context of small courses.
A third quizzing format has been studied in both traditional and virtual contexts. Commonly referred to as “mastery” quizzes, the definition and application of this assessment strategy are not consistent within the literature. The distinguishing feature shared among mastery quiz formats is that students have multiple attempts to take any given quiz. Typically, in a virtual context, each mastery quiz randomly selects from a pool of previously prepared questions on a designated topic. The random selection of questions fosters a more dynamic interface because it is unlikely that multiple attempts are identical, assuming a sufficiently large question-bank.
In an early study of digital mastery quizzes, this pedagogical tool was used as an instructional supplement to an online course (Maki and Maki 2001). Students were required to pass a web-based mastery quiz prior to a set deadline. Students were allowed to repeat the quiz and earned course points for passing up to four mastery quizzes. The researchers found that performance on the mastery quizzes was correlated with the student’s performance on exams given in a physical classroom setting (212).
Additional studies have also supported the correlation between online mastery quizzes and exam performance (Johnson and Kiviniemi 2009). Johnson and Kiviniemi’s mastery quiz format required students to take an electronic quiz based on the weekly assigned readings. Administered by a web-based system, the software randomized both questions and answer choices to prevent students from memorizing response-options. However, students were not given a time limit, and there were no apparent controls to limit the potential for cheating in this study. Brothen and Wambach (2004) have suggested that online-quiz time limits are associated with better exam performance because they reduce the opportunity to look up answers in lieu of learning the material.
Other studies have defined a mastery quiz as an “unannounced spot quiz that is presented twice during class, once at the beginning of the lecture period and then again at the end” (Nevid and Mahon 2009, 29). This pre-lecture and post-lecture application of the mastery quiz concept allows students to acquire knowledge on the tested concepts and focuses their attention during the lecture period. The authors of the study found that students showed significant improvements assessed by pre-lecture and post-lecture comparisons. Credits earned on mastery quizzes also predicted exam performance on concepts covered by the mastery quizzes (Nevid and Mahon 2009).
Collectively, this body of literature largely suggests that quizzing is a beneficial pedagogical strategy, but warns that the relationship with student performance has been somewhat inconsistent. This begins to imply that quizzes may present greater assessment benefits than teaching and learning outcomes. However, none of the studies reviewed have focused on the use of mastery quizzes as a means of assessing an instructor’s classroom activities. Therefore, this study highlights the application and lessons learned from a “blended” quizzing approach that incorporated web-based, pre-lecture and post-lecture mastery quizzes within a physical classroom setting as a means of assessing the effectiveness of face-to-face lectures.1
Methods and Procedure
Data was collected during a single semester in a landscape architecture construction course at a small east coast university. The program is only offered at the graduate level and thus the course was comprised of a small set of graduate students (N = 11, 73% women). The class generally reflected the graduate school’s ethnic (75% = White) and age (mean age = 29.3) composition. Permission from the university’s institutional review board was received to use course and survey data to analyze the effects of mastery quizzes implemented in the course.
Previous pedagogical studies of landscape architecture construction studios have suggested that there are significant differences between the learning preferences of undergraduate and graduate students. In a 2003-04 survey, online lectures were found to be highly preferred by graduated students, compared to undergraduate students (Li 2007). This finding was supported by a 2011-12 survey which reported that undergraduate students significantly preferred in-class lectures using PowerPoint slides (Kim, Kim, and Li 2013). The authors of this multiyear study concluded that undergraduate landscape architecture students are “more likely to rely on the help from instructors or classmates rather than to prefer individual or independent learning” (ibid. 95).
Differences in learning styles between undergraduate and graduate cohorts have also been reported in the context of “e-learning” outside of the landscape architectural discipline. Novice undergraduate e-learners significantly differed from graduate e-learners in two indexed learning style domains, including information perception and information understanding (Willems 2011).
Given the context of the research within a graduate program, it was impossible for this study to make similar comparisons across learner cohorts. However, it is important to note that the course and its materials have been developed within a context of a first-professional curriculum. Therefore, the materials, concepts, and topics covered by this course do not dramatically vary whether it is offered on an undergraduate or graduate level. At either level, the learning objectives are largely dictated by accreditation standards and professional expectations.
For this study, we administered a total of 24 digital mastery quizzes throughout a single semester in a pre-lecture/post-lecture format. Specifically, online quizzes were developed using the university’s learning management system (Moodle). Each quiz was composed of low-level objective questions (true/false and multiple choice) and higher-level graphic problems (short-answer). The short-answer questions required students to solve a given problem presented in a graphic image. Thus, short-answer questions are classified here as requiring higher-level thinking skills because they required the students to “apply” concepts covered in previous lectures. In comparison, the lower-level questions simply asked students to “recall” new concepts presented in the week’s assigned reading.2
Six pre-lecture and six post-lecture quizzes were given at the start and end of each class prior to the mid-term examination. An additional six pre-lecture and six post-lectures quizzes covered the second half of the term and the material leading up to the final exam. In total, the quizzes accounted for 10% of each student’s final grade. All quizzes were announced prior to each lecture.
To limit cheating and manage the classroom schedule, a time limit was set on each quiz. The online quizzes were administered and taken by the students in the physical classroom at the start and end of each lecture and questions were randomly selected from a weekly question bank. Each class period was scheduled for three hours per week and allowed for ample time to implement the quiz format. Students were required to have laptops for every class meeting.
Results
Given the limited sample size (n=11), it was meaningless to test for any correlation between quiz and exam performance. However, as depicted in figure 1, the descriptive statistics reveal that there was a consistently higher post-lecture average quiz score. All quizzes were based on 10 available points. The average pre-lecture mastery quiz for the semester was 71.8%. In comparison, the post-lecture average score was 88.9%.
|
Quiz/week Number |
Pre-lecture Mean Score (SD) |
Post-lecture Mean Score (SD) |
Exam Mean (SD) |
|
2 |
8.32 (1.01) |
9.22 (1.02) |
|
|
3 |
6.26 (2.14) |
8.35 (1.37) |
|
|
4 |
6.50 (2.06) |
9.12 (1.34) |
|
|
5 |
6.45 (2.35) |
8.45 (2.10) |
|
|
6 |
6.80 (2.34) |
9.32 (0.83) |
|
|
7 |
7.88 (1.64) |
9.54 (0.89) |
|
|
Midterm Exam |
84.73 (14.33) |
||
|
10 |
8.36 (2.01) |
9.82 (0.57) |
|
|
11 |
7.36 (1.49) |
8.09 (1.73) |
|
|
12 |
8.09 (1.73) |
10.00 (0.00) |
|
|
13 |
4.27 (2.56) |
6.32 (2.83) |
|
|
14 |
8.55 (1.08) |
9.45 (0.78) |
|
|
15 |
7.30 (2.44) |
9.06 (0.91) |
|
|
Final Exam |
87.73 (5.06) |
Figure 1. Pre-lecture and post-lecture quiz averages compared to exam scores.
All quiz scores are out of a possible 10 points. All exams scores are out of a possible 100 points.
Using an ANOVA analysis of variance, we found that the mean pre-lecture and mean post-lecture scores varied significantly (F = 66.086, p < .001). Furthermore, a given week did not predict the difference between pre- and post-lecture scores (F= 0.899, p > .05). Given the controlled testing environment, these results begin to suggest a positive outcome in terms of the students’ understanding of the material. This finding is supported by the results of the course evaluation, which indicated all respondents (n=9) believed that the quizzes had aided in their learning of the course material. The majority of respondents also agreed that the mastery quizzes aided in their identification of new topics. In addition, students believed that quizzes aided in their review of course topics and encouraged good reading habits.
While the findings are not generalizable, this preliminary data suggests that positive learning outcomes could be measured between the pre- and post-lecture average quiz scores. The question of whether weekly mastery quizzes actually increases learning cannot be asked of this contextual data. As others have pointed out, many factors influence test scores, including the wording and formatting of individual questions (Urtel et al. 2006). Therefore, a more appropriate question for this type of data is: “How can weekly mastery-quiz results inform classroom instruction?”
Assessing the Effectiveness of Individual Lectures
As alluded to previously, the course data generated by the mastery quiz format can also be used to gauge teaching effectiveness. By graphically charting and comparing each weekly mean, it is possible to visualize the relative effectiveness of each course lecture (see Figure 2). This technique is especially useful in smaller courses with limited enrollment where more robust statistical analysis is not possible.
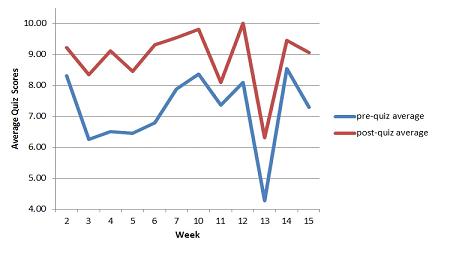
Figure 2. Graphic comparison of pre-lecture and post-lecture mean scores.
Figure 2 displays the consistent improvement suggested earlier by the data in previous table. Obviously, the post-lecture average scores are greater than the pre-lecture averages throughout the semester. More importantly, the distance between the charted lines begins to depict the degree of effectiveness of each face-to-face lecture. In short, the degree of student improvement — and (arguably) the effectiveness of a given week’s lecture, material, and planned activities — is revealed in the space between the charted averages.
From a theoretical perspective, this simple interpretation of the descriptive statistics allows us to more closely assess the quality of the instruction as opposed to student performance. We would argue that this chart begins to identify which specific weeks of instruction need the greatest improvement. This concept can be more clearly depicted by charting the difference between pre-lecture and post-lecture scores against the semester average improvement of the mean scores (see Figure 3).
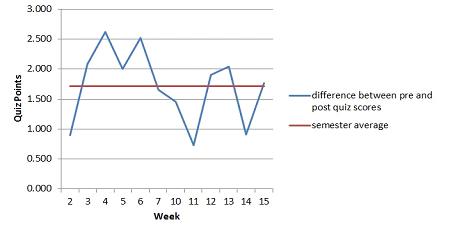
Figure 3. Average weekly improvement in post-lecture scores as compared to the semester’s average improvement on weekly quizzes.
On average throughout the semester, students scored 1.72 points greater on a post-lecture quiz as compared to a pre-lecture quiz. Figure 3 shows which weeks drop below this average. Thus, this analysis helps the instructor to identify specific weeks in their lesson plans that should be targeted for improvement. The efficiency of this course assessment strategy is mirrored by the promptness by which students receive feedback from the digital quiz format.
Based on our experiences with technique, we would argue that the digital mastery quiz format is a useful course assessment strategy that can guide instructional efforts. In addition, the efficiency of a digital format and the speed which feedback is generated outweigh for us any remaining concerns regarding the statistical significance between quiz results and student exam performance. Thus, the following section highlights additional software techniques that aid in the interpretation of the data that is generated by digital mastery quizzes.
Google Motion Charts
As noted earlier, both pre-lecture and post-lecture quiz scores were recorded in the university’s learning management system and charted as a series of averages. While it proved to be a convenient way to track quiz scores, it created several challenges for analyzing individual student progress over time. Also, given the relatively small sample size, it became important to consider the data from multiple aspects in order to make full use of it. With these two issues in mind, a search for another tool to analyze the data proved necessary. After experimenting with several different visualization tools, Google Motion Chart was selected, based on its ability to provide animation and a multi-dimensional analysis in a interactive, easy-to-understand way.
In addition, the Google Motion Chart was a freely available gadget within Google Docs (now Drive), making it an easy and viable tool for us, and others, to use. In 2007, Google acquired the software Trendalyzer, used by Hans Rosling. It was incorporated as a Google Gadget, an option that can be inserted into any Google Spreadsheet.3 In its essence, the motion chart is a Flash-based chart used to explore several indicators over time. Again, this made it the ideal tool to explore as it provided up to four dimensions for analysis. As illustrated in Figures 4 and 5, the parameters we used for analysis were pre-lecture quiz scores (x-axis); post-lecture quiz scores (y-axis); and the difference between the pre- and post- scores for individual students (color).

Figure 4. Data formatted in Google Spreadsheet and converted to a Google Motion Chart.
Once the data is converted to a Google Motion Chart, a “play” button appears in the lower left of the chart. When clicked, this button sets the data in motion. Optional “trails” or lines feature assist in tracking individual student progress over time (see Figure 5). The Google Motion Chart allows these variables to be quickly modified as needed by choosing a different variable from the drop down list provided. Once the chart is set in motion, it becomes easy to focus on one aspect of the data set.
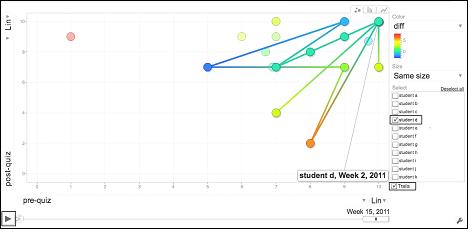
Figure 5. A Google Motion Chart illustrating a student’s scores over the course of the semester.
In our example, we focused on the difference between the pre-lecture and post-lecture scores represented by color and charted by the gadget over time. The more blues and greens represented, the smaller the difference between pre- and post- scores (see Figure 6), while the more yellows and reds, the greater the difference (see Figure 7). This quickly provides a way for instructors to gain a general sense of the gap differences and thus student performance on the quizzes.
Figure 6. A Google Motion Chart (captured as a movie) illustrating less positive learning outcomes as evident by the cooler colors
Figure 7. A Google Motion Chart (captured as a movie) illustrating more positive learning outcomes as evident by the warmer colors
Discussion
Anecdotally, we found that the mastery quizzes did encourage regular, punctual attendance. All quizzes were electronically “opened” and “closed” to students based on the precise timing of the physical class meetings. The learning management software does allow the instructor to restrict access based on an IP address; thus in larger courses these settings could potentially increase attendance. However, the question of whether the quizzes actually promoted the completion of reading assignments prior to class warrants further investigation.
The consistent improvement in post-lecture averages suggests that the mastery quiz format guided the students’ understanding of the material by signaling important concepts. Students overwhelmingly expressed favorable attitudes towards the mastery quizzes in their evaluation of the technique. These results seem to suggest positive learning outcomes. However, the findings are not generalizable and outcomes between different learner types should be considered in future studies.
Our experience highlights the usefulness of the digital mastery format as a course assessment strategy. The efficiency and clarity in which digital quizzes provide feedback to the instructor regarding his or her relative success in the classroom seems to present compelling justification for the implementation of this strategy in other courses. The electronic benefits of the digital quiz format are further enhanced by the abilities of current web-based software to aid in visualization and analysis the data.
The selection of the Google Motion Chart as our visualization tool for the data provided a unique opportunity to not only see the changes in both individual and class performance over time, but more importantly, it allowed the instructor to monitor quiz results concurrently for each given week of the semester. As additional data is added to the Google Spreadsheet, the motion chart should provide the instructor with a means for quick analysis of student progress over time, making this a useful retrospective tool to help inform teaching decisions. This is just one simple interpretation of the data; we feel, however, there is value in being able visualizing data in this manner. It can provide instructors with the ability to see classroom trends and patterns over time. However, we do not want these assessment benefits to overshadow the perceived pedagogical value of the quizzing format as a teaching technique.
The digital mastery quiz format also presented equally important instructional opportunities. The pre-lecture quizzes were designed not to provide additional feedback to the students; they only notified the students if they had answered the question correctly or not. This aspect of the quiz design was implemented in an attempt to focus the students’ attention on specific content they seemingly did not understand. Anecdotally, this design detail of the assessment strategy seemed to significantly increase the number of questions at the start of the lecture and increased the overall engagement of the students during class as compared to previous semesters in which the course was taught.
From this perspective, digital mastery quizzes presented a valuable catalyst for class discussion. As suggested by Connor-Greene (2000), assessment and testing can become a more dynamic process rather than a static measure of student knowledge if it is used to generate classroom conversation. Therefore, we believe that the blended nature of the digital mastery format, as it was implemented in our study, was critical in meeting our educational objectives. Specifically, the pre-lecture quiz administered at the start of each class combined the efficiency of online quizzing with the opportunity for immediate and collaborative discussion in the physical classroom. This approach to quizzing seemingly encouraged students to “test their knowledge” and then use the scheduled classroom period as an opportunity follow up with questions in a more interactive and personal forum.
Finally, daily quizzes can also be a catalyst for multiple levels of thinking if more robust question types are included in the design of the quiz. We included both “recall” and “applied” short-answer questions within our quiz design. In hopes of increasing additional levels of higher-order or critical thinking, future development of the mastery quiz format should focus on the quality and extent of thinking required by distinct question types. Assessment strategies and techniques must be consistent with the level of thinking an instructor is attempting encourage in the classroom. In terms of digital and online quizzes, new electronic question types such as “drag-and-drop” responses are increasingly allowing instructors to develop higher-level assessment. Therefore, all educators could benefit if future research increases our understanding of the relationship between digital question types, quiz outcomes, and Bloom’s (1956) Taxonomy.
Bibliography
Angus, Simon, and Judith Watson. 2009. “Does regular online testing enhance student learning in the numerical sciences? Robust evidence from a large data set.” British Journal of Education Technology no. 40 (2):255-272.
Bloom, Benjamin. 1956. Taxonomy of educational objectives, Handbook I: The cognitive domain. New York: David McKay.
Brothen, Thomas, and Cathrine Wambach. 2001. “Effective student use of computerized quizzes.” Teaching of Psychology no. 28 (4):292-294.
———. 2004. “The Value of Time Limits on Internet Quizzes.” Teaching of Psychology no. 31 (1):62-64.
Connor-Greene, Patricia. 2000. “Assessing and promoting student learning: Blurring the line between teaching and testing.” Teaching of Psychology no. 27 (2):84-88.
Daniel, David, and John Broida. 2004. “Using web-based quizzing to improve exam performance; Lessons learned.” Teaching of Psychology no. 31 (3):207-208.
Haberyan, Kurt. 2003. “Do weekly quizzes improve student performance on general biology exams.” The American Biology Teacher no. 65 (2):110-114.
Haigh, Martin. 2007. “Sustaining learning through assessment: An evaluation of the value of a weekly class quiz.” Assessment & Evaluation in Higher Education no. 32 (4):457-474.
Johnson, Bethany, and Marc Kiviniemi. 2009. “The effect of online chapter quizzes on exam performance in an undergraduate social psychology course.” Teaching of Psychology no. 36:33-37.
Kibble, Jonathan. 2007. “Use of unsupervised online quizzes as formative assessment in a medical physiology course: Effects of incentives on student participation and performance.” Advances in Physiology Education no. 31:253-260.
Kim, Young-Jae, Jun-Hyun Kim, and Ming-Han Li. 2013. Learning vehicle preferences and web-enhanced teaching in landscape architecture construction studios. Paper read at Council of Educators in Landscape Architecture Conference: Space, Time/Place, Duration, March 27-30, 2013 at Austin, Texas.
Li, Ming-Han. 2007. “Lessons learned from web-enhanced teaching in landscape architecture studios.” International Journal on E-Learning no. 6 (2):205-212.
Maki, William, and Ruth Maki. 2001. “Mastery quizzes on the web: Results from a web-based introductory psychology course.” Behavior Research Methods, Instruments, & Computers no. 33 (2):212-216.
Narloch, Rodger, Calvin Garbin, and Kimberly Turnage. 2006. “Benefits of prelecture quizzes.” Teaching of Psychology no. 33 (2):109-112.
NCAT, The National Center for Academic Transformation. 2012. Program in course redesign; The supplemental model 2012 [cited October, 17 2012]. Available from http://www.thencat.org/PCR/model_supp.htm.
Nevid, Jeffrey, and Katie Mahon. 2009. “Mastery quizzing as a signaling device to cue attention to lecture material.” Teaching of Psychology no. 36:29-32.
Urtel, Mark, Rafael Bahamonde, Alan Mikesky, Eileen Udry, and Jeff Vessely. 2006. “On-line quizzing and its effect on student engagement and academic performance.” Journal of Scholarship of Teaching and Learning no. 6 (2):84-92.
Willems, Julie. 2011. “Using learning styles data to inform e-learning design: A study comparing undergraduates, postgraduates and e-educators.” Australasian Journal of Educational Technology no. 27 (6):863-880.
About the Authors
Kyle Beidler is an Assistant Professor at Chatham University in the Landscape Architecture Program. His research and teaching interests include design education, neighborhood planning, sustainable site engineering practices and the integration of digital technologies with design communication. Kyle received his PhD in Environmental Design and Planning from Virginia Tech and recently completed Chatham’s Faculty Technology Fellows Program from which this project and article originated.
Lauren Panton is the Manager of Instructional Technology and Media Services for Chatham University. She leads the Faculty Technology Fellow Program, which supports faculty with technology-enhanced projects in teaching, learning, and scholarship. Her academic interests include the scholarship of teaching, as well as technologies related to data visualization, multiple modalities and blended learning.
- In the context of this paper, a supplemental model of blended learning is conceptualized as a pedagogical strategy that retains the “basic structure of the traditional course and uses technology resources to supplement traditional lectures and textbooks” (NCAT 2012). ↩
- For a complete discussion regarding the relationship between quiz questions and Bloom’s Taxonomy of Educational Objectives, please see Connor-Green (2000). ↩
- Google has announced that in 2013 it will be deprecating Gadgets in Google Spreadsheets, however the motion chart type will be incorporated as a regular chart option (to insert one of these charts, from the Insert menu, select Chart.). No specific date has been announced; please check the Google Drive support site for additional information. ↩
'Incorporating the Virtual into the Physical Classroom: Online Mastery Quizzes as a Blended Assessment Strategy' has 9 comments
December 3, 2013 @ 7:07 pm How to Use Online Learning Tools to Increase Interaction and Improve Learning Outcomes : Ted Curran.net
[…] Incorporating the Virtual into the Physical Classroom: Online Mastery Quizzes as a Blended Assessmen… […]
June 3, 2013 @ 1:54 pm Assessing Coursera, the LMS | Bloviate
[…] some space here for thoughtful pedagogical work that reinforces certain ideas from course content (quizzes can be useful). The prompts for the essays however are widely varied: in one class I “took” the same […]
May 28, 2013 @ 8:48 pm How to Use Online Learning Tools to Increase Interaction and Improve Learning Outcomes
[…] Incorporating the Virtual into the Physical Classroom: Online Mastery Quizzes as a Blended Assessmen… […]
May 21, 2013 @ 8:49 am @krisshaffer
RT @JITPedagogy: New in JITP: Online Mastery Quizzes as a Blended Assessment Strategy by Kyle Beidler & Lauren Panton http://t.co/brxHB26Sv9
May 17, 2013 @ 4:07 am With Google Play For Education, Google Looks To Challenge Apple’s Dominance In The Classroom | whatsweb
[…] Incorporating the Virtual into the Physical Classroom: Online Mastery Quizzes as a Blended Assessmen… (jitp.commons.gc.cuny.edu) […]
May 15, 2013 @ 3:30 pm Introduction
[…] “Incorporating the Virtual into the Physical Classroom: Online Mastery Quizzes as a Blended Assess… Kyle Biedler and Lauren Panton present their research on web-based, in-class, pre- and […]
May 15, 2013 @ 3:30 pm Table of Contents: Issue Three
[…] Incorporating the Virtual into the Physical Classroom: Online Mastery Quizzes as a Blended Assessmen… Kyle Beidler and Lauren Panton […]
May 15, 2013 @ 1:23 pm @JITPedagogy
New in JITP: Online Mastery Quizzes as a Blended Assessment Strategy by Kyle Beidler & Lauren Panton http://t.co/brxHB26Sv9
May 15, 2013 @ 11:13 am @JetmirTroshani
Incorporating the Virtual into the Physical Classroom: Online Mastery Quizzes as a Blended Assessment Strategy http://t.co/m4BhNxY3cQ