Using ePortfolio Image Galleries as Digital Storyboards to Visualize Scientific Concepts
Karla Fuller, Guttman Community College
Students in a Human Biology course showed improvements in comprehending a complex scientific process when they were asked to model the process and create storyboards in their ePortfolios.
A storyboard is a graphic organizer in the form of illustrations or images displayed in sequence for the purpose of visualizing a motion picture, animation, motion graphic or interactive media sequence. In the same way that storyboards are used in media and film education to help students learn how to construct visual stories, they can also be useful in science education to help students make sense of the complex series of events that take place during scientific processes. When used in this manner, the storyboard provides an alternative to the standard graphic organizers that are often employed to help students connect concepts.
Each semester, I watch students struggle to understand highly complex biological processes and grapple with the push and pull of positive and negative feedback loops. One of the most difficult concepts for my Human Biology students to comprehend is neuromuscular activation of muscle contraction. In order to accurately describe this concept, students must merge their understanding of the way the nervous system works and how it influences individual muscle cells. I have tried this before—with varying levels of dissatisfaction—with more common graphic organizers like concept maps and flow charts but found that students were not able to make connections between neuronal stimulation and muscle contraction at the molecular level without heavy pushing from me, even though they are proficient in describing the two actions separately.
After helping a student organization plan a short promotional video using storyboards, I decided to try the storyboards in class during the neuromuscular action unit. Instead of using storyboards to visualize camera angles that would provide the best views of an action sequence in a video, we could use them to visualize the overlapping actions and adventures of molecules in biological processes. Narrating the movement of molecules and the subsequent downstream muscle contraction during the process of creating the storyboards is helpful in demonstrating not only the overall mechanism of contraction and relaxation but also the minute details of how molecules interact with one another in order to initiate these processes.
My course relies heavily on ePortfolios for students to demonstrate their mastery of the concepts they are learning. In addition to providing a space for meta-cognitive reflection on their learning, which supports the transfer of knowledge of the principles of science (i.e. critical thinking, research analysis, hypothesis-building) across the various disciplines that students are studying, I find the ePortfolio to be a useful tool for curating and assessing lab reports and dispatches from the field. Students can easily incorporate digital photos of their experiments, hand-drawn schematics or group-curated documents. For the storyboarding activity, we asked students to create an ePortfolio module that would at once allow me (the assessor) to track their progress in this scaffolded activity and provide a robust multi-modal study guide for the neuromuscular unit. The use of the ePortfolio environment allowed students to share their work easily with their classmates for peer review and provided a way for me to give feedback throughout the activity.
The Assignment
This was a scaffolded activity that took place over four lecture periods and one lab. It consisted of the assignments outlined below. Each assignment was uploaded to the students’ ePortfolio.
- Planning jigsaw
- Students individually outline the process of neuromuscular action from relaxation to contraction to relaxation.
- Students meet in groups and give feedback on each other’s outlines. The group then constructs a common group outline that they submit for assessment and feedback from the instructor (Figure 1).
- Storyboarding
- Students use their group outlines to plan the “story” of the contraction and relaxation process in paragraph form before creating the storyboards. (Figure 2).
- Students work in their groups with the materials provided to create their storyboards, taking digital photos of each “scene.” Students use these photos to create a captioned gallery of their storyboards in their ePortfolios (Figure 3).
- Gallery Walk
- Each student is assigned a different group’s ePortfolio to view and give feedback.
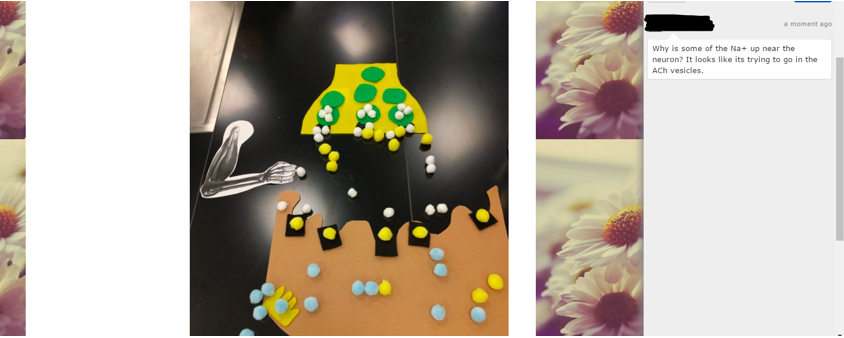
- Groups make revisions to their galleries based on feedback (Figure 4).
- The final storyboard gallery is submitted and assessed using a Digication-based rubric linked to the uploaded storyboard (Figure 5).
- At the end of the activity, I post the digital storyboard with the highest rubric score on the course ePortfolio. Students can use this as a model to correct any inaccuracies in their own storyboards.
In the end, students worked together to create comprehensive outlines of a complex biological topic that they were struggling with. To evaluate each student’s contribution to the work, the submission process includes individual reflections that ask students to state their specific contributions and discuss how well (or not) the other group members contributed to the overall project.
The textbook that we currently use has full-color sequential graphics of the neuromuscular junction and the events of muscle contraction. I have noticed over the years that even as students look over the pictures, they tend to focus on the initiating and culminating events, with just a quick glance over the middle – which is where the “action” is. Thus, students move on from the graphics with only a “big picture” overview, essentially skipping the details. The storyboarding activity requires the students to manipulate the materials, creating a “live-action” version of the drawings. By physically manipulating the materials to show the interactions of molecules, students must focus on the details of molecular interaction in a step-by-step manner. Re-creating the process with their own hands helps students internalize the entire process, including the middle, where multiple signaling cascades are happening all at once. This enhances their understanding of the individual events occurring at the molecular level that bridge neuronal stimulation with muscle activation.
Breaking the assignment down into smaller parts allows multiple opportunities and modalities for students to interact with the topic. Students receive early feedback from me after the group outline step, feedback from their classmates during the gallery walk and additional feedback from me after the final submission. Structuring the project this way offers multiple opportunities for revision (without taking up any additional class time!). Multiple revisions were extremely helpful at clearing up misconceptions.
In previous semesters, I have asked students to write the steps of muscle contraction beginning with neuronal activation with the option to support their outline with drawings. I found that students often omitted details (ie. naming specific molecules), or had trouble sequencing events that happen simultaneously. The pre-test given before the assignment in both this and previous semesters affirmed these two areas of weakness. However, on the post-test, students who participated in the storyboard activity showed an average increase of twenty-five percent in scores compared to students from previous semesters who did not storyboard. Furthermore, all of the students who used the storyboard scored higher on the post-test than students during the non-storyboard semesters. From my perspective, the storyboards provided an easy-to-assess learning tool while also serving as a handy at-a-glance study guide for the students. The ability to successfully visualize their understanding of a topic can build confidence and promote deeper learning.
A sample completed ePortfolio storyboarding assignment can be viewed at http://bit.ly/1TFvhR8.

Figure 1 – Group outline in Digication ePortfolio. Instructor’s post-assessment feedback is in the right margin.
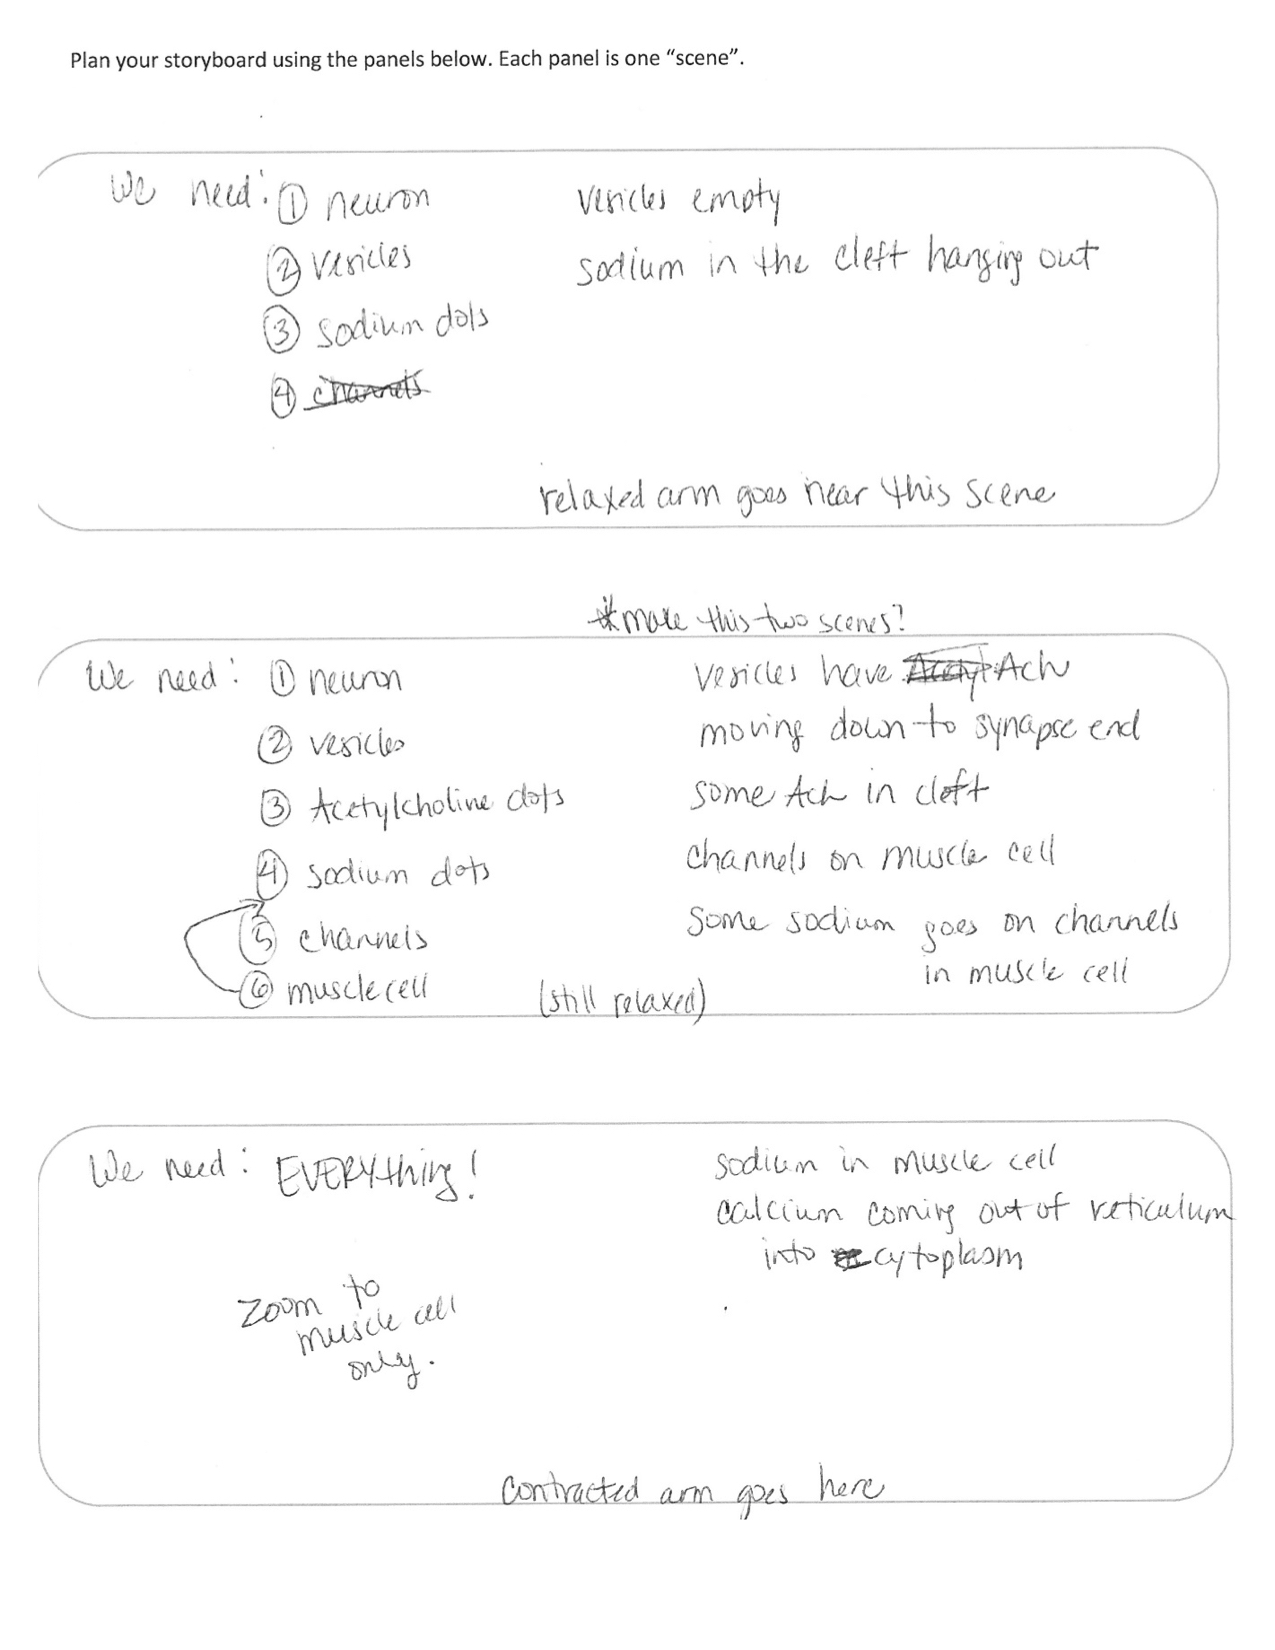
Figure 2 – Storyboard planning document completed by group before staging “scenes.”
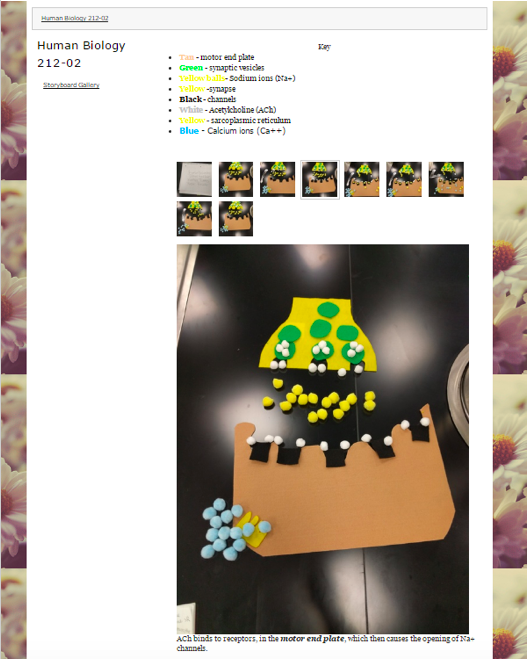
Figure 3 – Example of a student group’s completed storyboard in their ePortfolio.

Figure 4 – Post-gallery walk storyboard with comments from another student in right margin.

Figure 5 – Digication ePortfolio rubric.
Appendix A

'Using ePortfolio Image Galleries as Digital Storyboards to Visualize Scientific Concepts' has 3 comments
March 20, 2017 @ 9:18 am Open pedagogy event: Multimedia pedagogy across the disciplines | ACERT
[…] Using ePortfolio Image Galleries as Digital Storyboards to Visualize Scientific Concepts, Karla Fuller of Guttman Community College, The Journal of Interactive Technology and Pedagogy. […]
March 10, 2017 @ 11:44 am In common this week: Taking Your Class Online – In Common
[…] (JITP) was one of the first publications on the Commons so it’s an oldie-but-goody. In the most recent post in their “Assignments” section, Karla Fuller of Guttman Community College makes use […]
February 27, 2017 @ 10:13 am Guttman Community College
[…] Smith Fuller, Assistant Professor of Biology, has published an article in The Journal of Interactive Technology and Pedagogy about having students create digital storyboards using ePortfolio image galleries to help them […]