Introduction: Teaching with Historical Records in the Natural Sciences
In the sciences, primary sources can be defined as records of observations in the natural world. Teaching with primary sources is an integral part of inquiry-based learning, and both archivists and educators have embraced opportunities to use archival materials in the classroom. Allowing students to use the raw material of scholarship has the potential to reap benefits. Students learn to consider different perspectives and to think critically (Hendry 2007). Students might also feel more invested in their research when they get to see original sources (Tally and Goldenberg 2005). By working with primary sources in the sciences, students can develop their own skills of observation and analysis (Austin and Thompson 2015). The Discover – Explore – Connect project was developed to introduce middle and high school students to different types of historical records in the natural sciences, such as field notes, maps, and photographs. By engaging with these primary sources, the project aims to teach and enforce the skills of observation and analysis in both the classroom and outdoors. The project demonstrates how both educational and research tools can be developed and implemented when archival materials are made accessible through digitization.
In July 2016, the Archives of the Cleveland Museum of Natural History (CMNH) received a two-year grant from the National Historical Publications and Records Commission (NHPRC). The project, titled Discover – Explore – Connect: Engaging with the Environment through Historical Records in the Natural Sciences, was part of the NHPRC’s Literacy and Engagement with Historical Records program. The funding allowed the CMNH Archives to digitize 2.5 linear feet of records relating to Arthur B. Williams, a naturalist and educator who shaped outdoor education in the Cleveland area in the 1930’s – 1950’s. Digitization not only allows access to the irreplaceable primary sources, but does so in a way that allows preservation of the original documents and materials. The material was digitized by work-study students at Baldwin Wallace University, under the supervision of the University Archivist. The students who digitized the material learned how to handle fragile documents, use scanning equipment, and assign metadata to the finished electronic documents.
With the rich resources within the A.B. Williams archive digitized, teachers, students, researchers, and citizen scientists can access and use the material to glean valuable information about the natural world around them. Several interconnected projects have been developed that draw from the A.B. Williams Archive: a curriculum that contains both classroom and outdoor experiences, including a game; GIS applications; and a re-survey of the forest that allows for comparison with the historical data.
Results: Projects Derived from Digitized Materials
Lesson plans for ecological literacy
The goal of the Discover – Explore – Connect curriculum is to teach middle school and high school students the skills necessary to study the natural world around them. Through a series of lessons, students learn orienteering, species identification, mapping, taking field notes, and collecting data, with A.B. Williams as their guide. The curriculum is divided into three major sections: Skills Development and Game-Based Learning; Field Trip to A.B. Williams Memorial Woods; and the Land Ethic.
The lesson plans in the Skills Development section introduce students to primary sources and teach them how to identify and analyze different types of primary sources, such as maps, photographs, and written documents. Students also learn how to interpret and use different types of information that can be found in scientific documents, such as charts, data tables, maps, graphs, and diagrams. Additional lesson plans guide students in making observations, keeping field notes, finding their way around a map, and recording observations on a map. Subsequent lessons help students build skills in identifying different species of wildflowers, birds, and trees.
A unique addition to the curriculum is a game that was developed as an orientation for field trips to the A.B. Williams Memorial Woods in the North Chagrin Reservation of the Cleveland Metroparks. Well-designed games have been shown to facilitate engagement with learning (Dickey 2005; Abdul Jabbar and Felicia 2015) and improve meaning-making for the players (Ermi and Mayra 2005). The game was designed to deliver three main learning outcomes: familiarize students with the layout of the A.B. Williams Memorial Woods; provide a practical tutorial in using dichotomous keys to identify wildlife; and prepare students to survey plant and animals communities in the forest. By simulating the types of activities that will take place on their visit to the forest, students should be better prepared and focused during the field trip (Falk and Dierking 2000).
For the game’s design and construction, the A.B. Williams Memorial Woods was split into five regions based on different forest communities: Beech-Maple Association; Northwest Forest; Southeast Forest; Spurs and Ravines; and Swamp Forest (Figure 1).
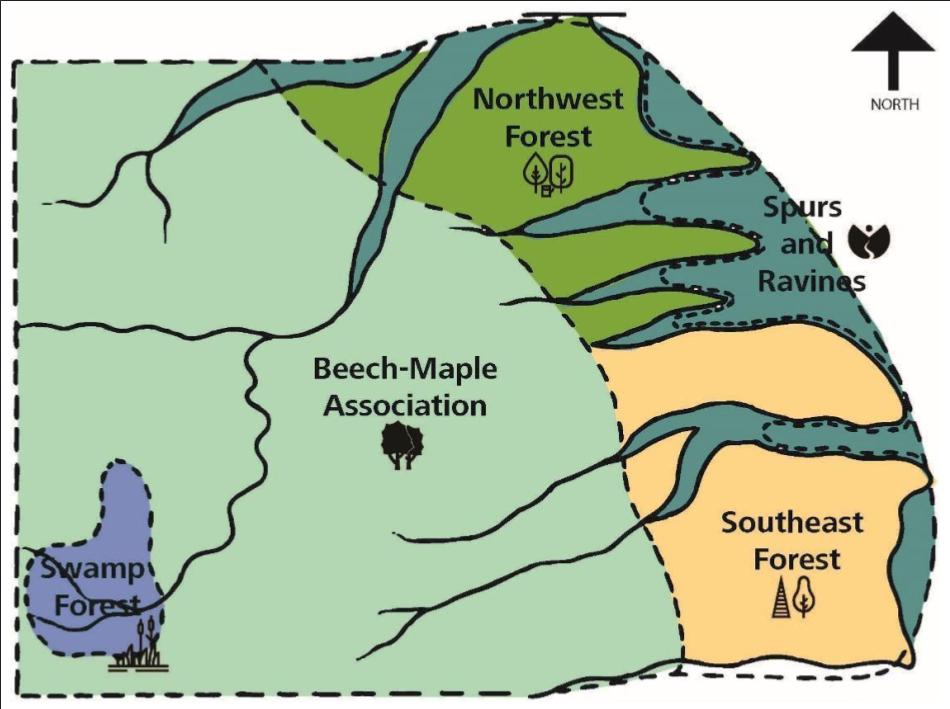
Figure 1. Game map showing the different regions of the A.B. Williams Memorial Woods in the North Chagrin Reservation of the Cleveland Metroparks
Using A.B. Williams’ historical survey data of tree distributions, decks of cards were constructed for each of these regions. Each deck contains between 17 and 39 cards. Individual tree species for each region are depicted on the cards using illustrations of leaves that were drawn by A.B. Williams and are part of the digitized collection; drawings of twigs and buds were created by the project’s graphic designer to provide additional information to aid species identification. Each card provides enough information for the tree species to be identified using the provided dichotomous key or a field guide, along with a symbol to allow for easy sorting of cards based on region, and a number value to indicate how many individual trees that card represents (Figure 2).
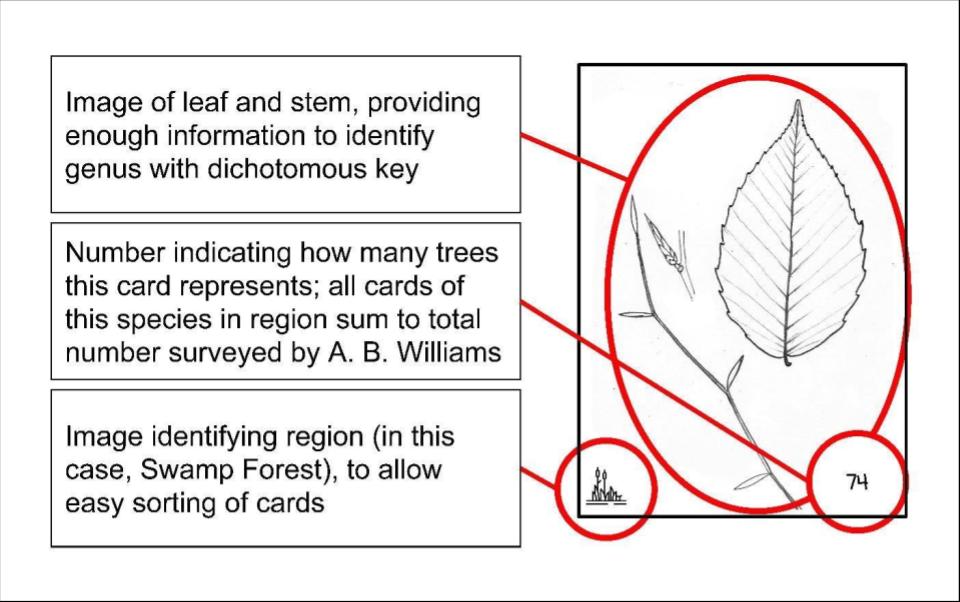
Figure 2. Example of card showing a single species of tree to be identified
For each deck, the number of cards depicting the same tree species is based upon the proportionate number of those trees surveyed in that region by Williams in the 1930’s (Williams 1936). To keep the decks at workable sizes while allowing for representation in the deck of all the tree species in each region, the ratio of number of cards to total count of corresponding tree species is arranged upon a log scale, which results in the number of cards per species corresponding roughly with order of magnitude rather than actual counts. Accompanying these decks are a specially constructed dichotomous key (Figure 3) and data collection sheets for student groups to record distribution data (multiple cards of the same species have different numbers to simulate the actual counting activity). Instructors also have an answer and scoring sheet that allows them to track student success rates and completion times, and to check on each group’s work.
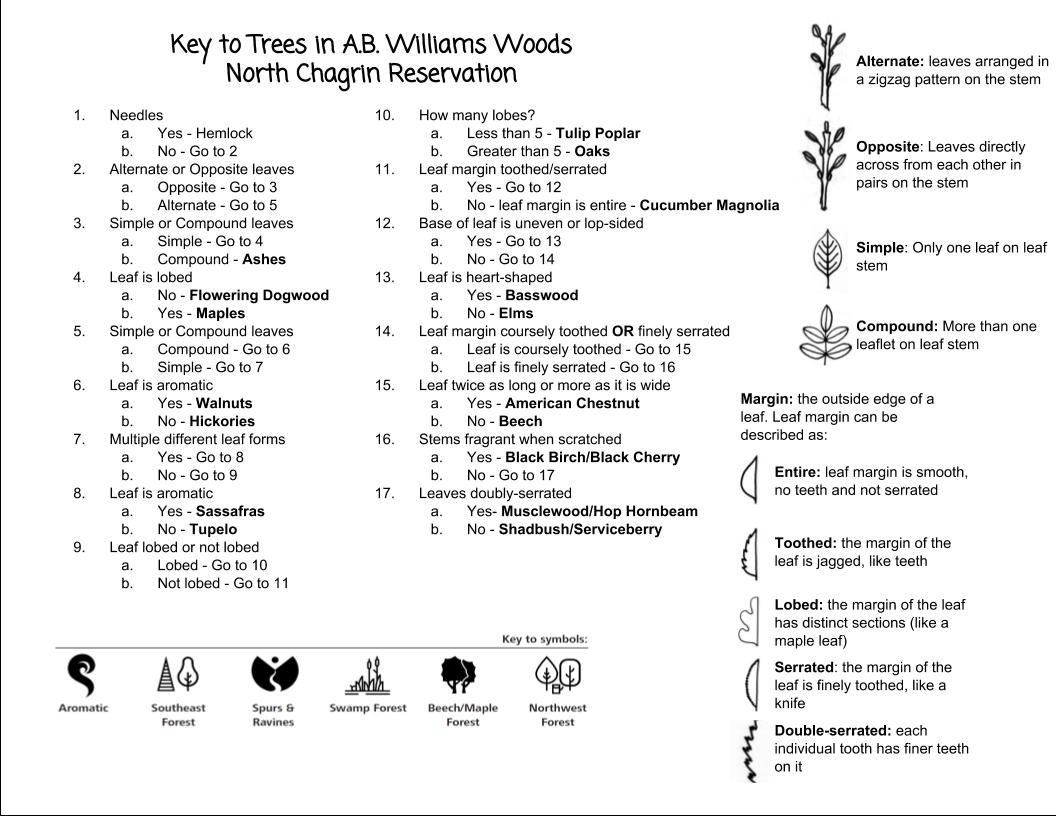
Figure 3. Dichotomous key to be used for identifying trees in the A.B. Williams Memorial Woods
Gameplay requires students to work together in teams to effectively and efficiently identify the trees in each region. The game can be played while sitting at a desk, but we encourage teachers to set up the classroom as the forest and have students move around from community to community. The instructor serves as a scorekeeper to track both accuracy and speed, and each student group competes to be best at identifying and surveying tree species. As players progress through surveying each region’s deck, they will grow more proficient in using the dichotomous key to identify trees, and they will acquire information on the distributions of individual tree species throughout the A.B. Williams Memorial Woods.
Future work can not only further develop this game, but also expand upon it to include modules that examine wildflowers and songbirds, using resources made available through the digitized A.B. Williams archival material. This game is designed in such a way that it can easily be adapted to any location that has robust biological survey data, with limited adjustment to its design. The game is currently being developed to work as a standalone boxed experience that can be played like a traditional board/card game as opposed to a classroom activity.
The Discover – Explore – Connect curriculum was introduced at a teacher workshop held at CMNH in February 2018. The 18 teachers who attended the workshop included classroom teachers, homeschool parents, university/college educators, and informal science educators (i.e., museum docents, library media specialists, park naturalists). Educators worked through several lessons and played a test version of the A.B. Williams Forest Community Challenge Game. We received valuable feedback on the game and the curriculum, and this input will help as we continue to develop both for future use.
Following the workshop, we tested the curriculum and field trip with five classes of 10th-grade biology students from a school within the Cleveland Metropolitan School District. The teacher had attended the workshop in February and, because her school has an extended academic year, she was able to work through some of the lesson plans and schedule a field trip. Project team members visited the school at the end of May and introduced the A.B. Williams Forest Community Challenge Game to each of the five biology classes during the school day. Fifty students learned how to use the dichotomous key to identify trees featured on the game cards. While challenging at first, by the end of each class we could see that the students had made a lot of progress. The game set the stage for the June 22nd field trip to the A.B. Williams Memorial Woods. Team members planned a full day of field experiences at four different stations in the woods. The 27 students in attendance, accompanied by their teacher and three chaperones, were broken up into four groups. Each group was led by a member of the project team as they cycled through all four stations and completed the activities, which included counting and measuring trees within a designated area, honing observation skills while focusing on sounds, and learning about the Civilian Conservation Corps’ efforts to build a shelter in the woods in 1933.
The field trip was a rewarding experience for everyone. While guiding a group into the forest, the leader held up a large leaf that had been found on the ground. One of the students immediately noticed its shape and started to identify it based on the dichotomous key used during the A.B. Williams Forest Community Challenge game in class. Following the field trip, the teacher solicited feedback from her students. One of the students said, “The field trip was very breathtaking…A.B. Williams – I feel like I was walking on his path [and] you saw his nature as it was…I feel like what he did was awesome.”
Our hope is that the Discover – Explore – Connect curriculum will be used in classrooms throughout the school year, so that by April or May teachers and students will be ready for at least one field trip to the A.B. Williams Memorial Woods. Lesson plans for the field trip include mapping and tallying trees and comparing those numbers with what Williams observed in those same woods 80 years ago. Once back in the classrooms, students turn to lesson plans that help them reflect on the changes that have occurred in the forest ecosystem and encourage them to examine their relationship with the natural world around them.
Where in the world…? Applying GIS technologies to historical records
The digitization of the Williams collection not only provides access to more easily view the materials, but an exciting further step is to integrate the historical maps using Geographic Information Systems (GIS). GIS is database software that allows disparate data sources to be integrated and assigned to specific coordinates on a map. This process requires that features in the maps be identified and related to a spatial reference system. The term ‘georeferencing’ is used to describe this process of adding a spatial reference system to the digital image of a historical map.
Along with visually comparing maps that have been georeferenced to the same spatial reference system, the features on the map can be depicted using points, lines, and areas. These point, line, and area features can then be graphically manipulated, incorporated with other spatial data sets, and quantitatively analyzed. For example, Williams made many maps of the trees in the North Chagrin Reservation of the Cleveland Metroparks; when georeferenced, the trees drawn on these maps can be converted to points, combined with trees from other maps, and drawn in any cartographic style.
Georeferencing the hand-drawn maps from Williams was both challenging and critical to the accuracy of any derived spatial data sets. Whatever spatial uncertainty is present in the georeferencing (there was considerable uncertainty) will be propagated through any future uses of the maps. The general strategy in georeferencing is to find features on the map that can either be located on other spatial data sets, such as aerial photography or topographic maps, or can be located in the current landscape. Whether on other imagery or in the current landscape, these identifiable locations used for georeferencing the historical maps are known as ground control points or GCPs.
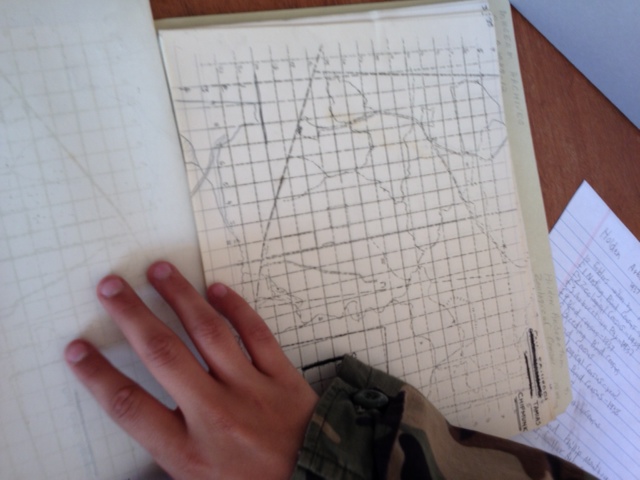
Because Williams included different features on different maps but did not ever include all the features on a single map, the necessary strategy was to georeference his maps by using the best ground control points from each map. For instance, features on Williams’ maps that could not move over time, such as the foundation of the Trailside Museum in the North Chagrin Reservation, provided the best way to match features on the historical map to current features in the landscape whose coordinates we can measure with global positions systems (GPS). Because there were not enough of these more permanent features, other features such as bridges and trail intersections were also used. Since these features have a higher likelihood of having moved over the past eight decades, they introduce more uncertainty into the georeferencing process. Three authors of the paper went out into field in September of 2017 to obtain the GPS coordinates of locations/objects that were present on A.B. Williams’ various maps and could potentially be used as ground control points (Figure 4).
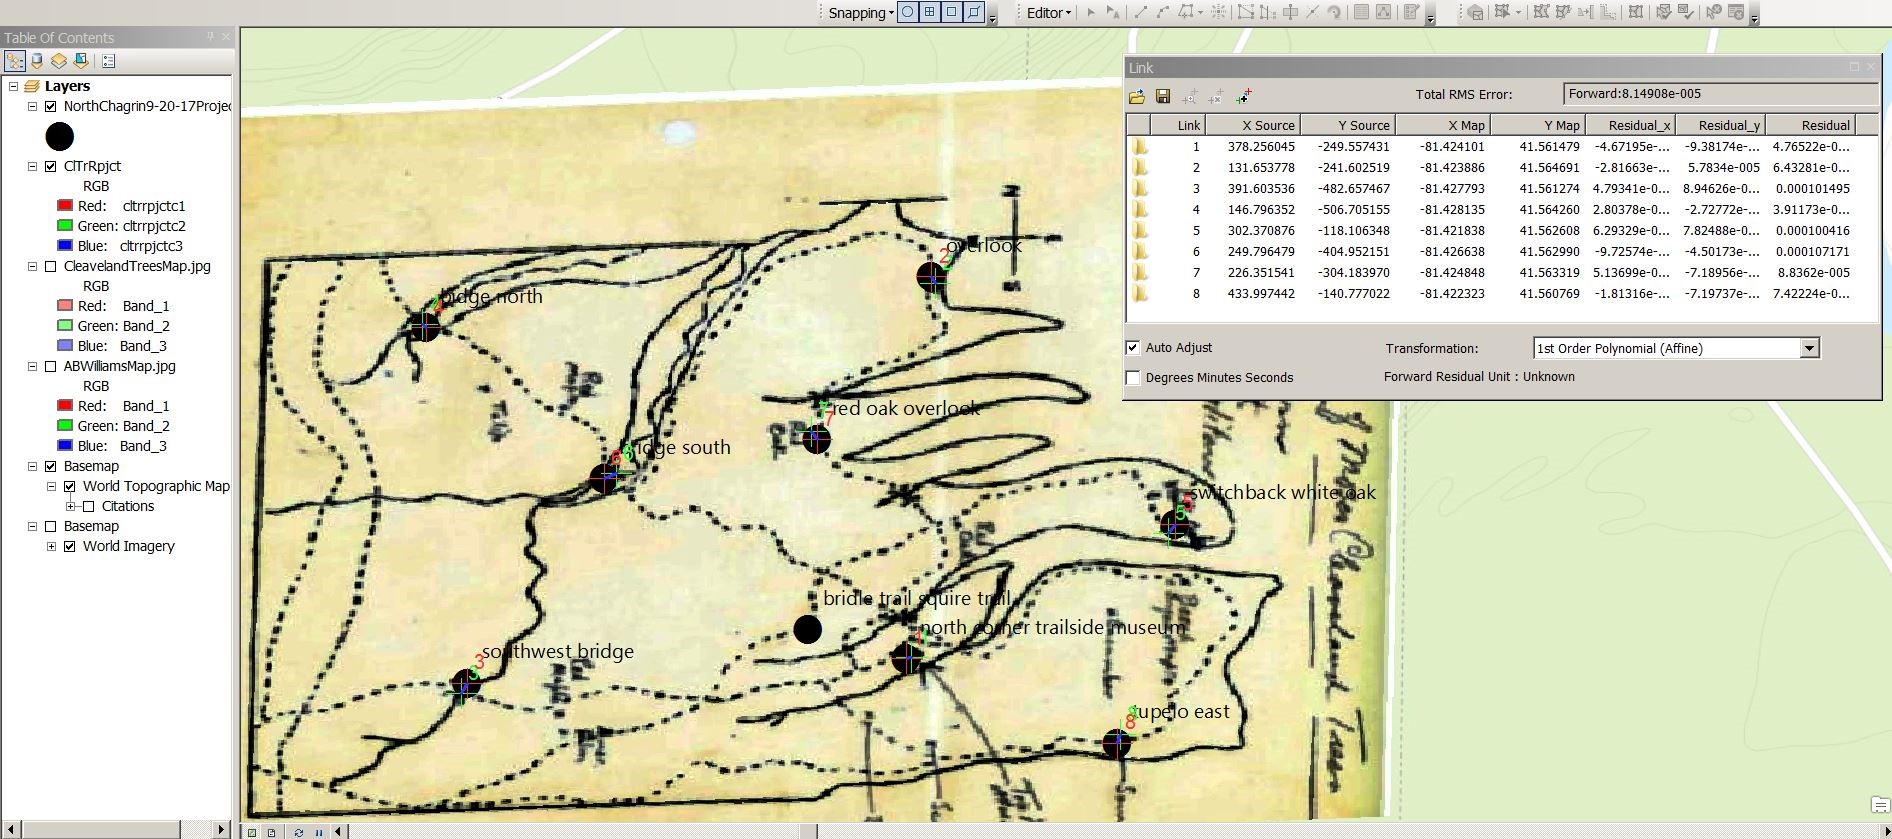
Figure 4. A screenshot showing one of A.B. Williams’ hand-drawn maps matched to GPS coordinates of GCPs. The table on the top right of the image shows details on the GCPs such as latitude and longitude, as well as root mean square error (RMS).
In several GIS and Cartography courses, undergraduate and graduate students were provided with digital versions of some of Williams’ maps of trees by species and ground control points generated by the instructors. Since Williams produced no single map that contained all the features that could serve as GCPs, the students were instructed to utilize a series of exterior points on the species maps derived from the original georeferencing attempt (Figure 5).
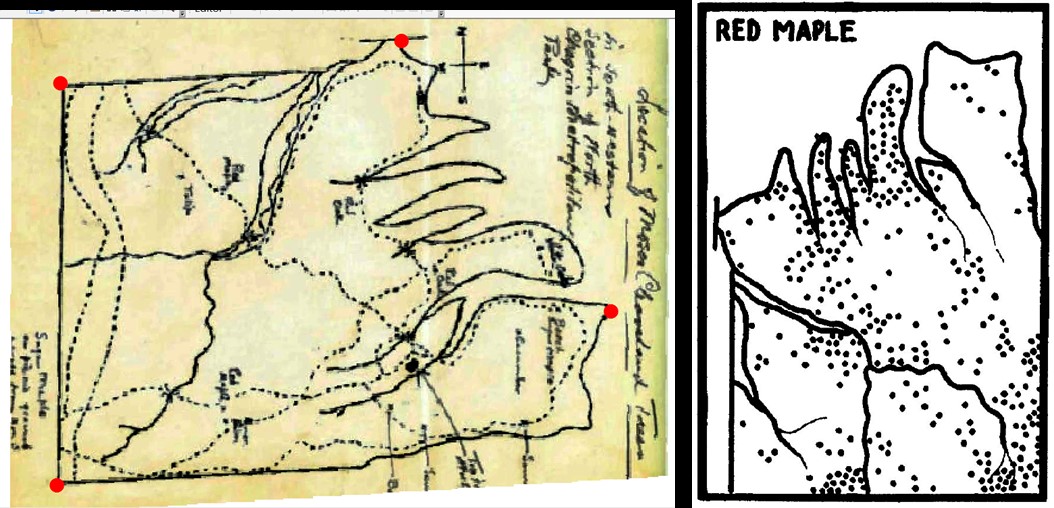
Figure 5. GPS coordinates were used by instructors to georeference an A.B. Williams map (left map above) and then four clearly identifiable locations were chosen for students to use to georeference maps of individual species such as the map of red maple.
The students then georeferenced their assigned species maps and created point representations of the individual trees. This assignment covered several core GIS methods, including georeferencing, feature creation, editing attribute tables, and spatial reference system concepts, while engaging students in the creation of new geospatial data that will be used in future coursework, research, and public displays. The use of historical data also allowed an important discussion of the value of archives in change analysis and the sources and implications of uncertainty in spatial data.
The spatial data sets of tree locations created by the students in the GIS and Cartography courses were then analyzed by students in a Spatial Analysis course. The students in this course were learning to use spatial statistical methods to identify and describe spatial patterns in large data sets. The data set of tree locations created in the earlier exercise included the species of the tree, so interspecific comparisons of clustering and dispersion were done by the students using common spatial statistics, such as average nearest neighbor, quadrat analysis, and Ripley’s K function. Several of the students in the Spatial Analysis course were also in the GIS or Cartography courses, and they were able to help explain the larger story of Williams’ work to the students who had not previously been exposed to the archive. Anecdotally, student reflections suggest that the use of historical hand-drawn maps makes the presence of spatial uncertainty more obvious than with modern digital data sources. Students were able to translate the uncertainty introduced from the data source into reasonable limitations in the interpretation of results.
While the maps that are part of the Williams archive have already proven to be pedagogically valuable, we expect to continue to develop these data sources in several ways. There are still numerous maps that need to be georeferenced and have their contents converted to spatial features. Our initial experiences in this process have been positive and instructive. As more of the maps are processed, the database available for spatial analysis will also grow. This database will be utilized by students in course assignments and individual projects. As more of the maps and spatial data are completed, students in the GIS Database Design course will be learning ways to make these databases publicly available through web mapping applications.
Once the maps have been processed and converted to features, they can be compared with the results of the re-survey efforts described in the next section of the paper. This increases the value of the data from analyzing the past to investigating how the present-day forests have changed. We expect that this highly detailed spatial database of plants and animal locations over an 80-year period in a highly urbanized and industrialized region will be valuable both for research and for communicating ecological change to the broader community.
Seeing the forest through the trees
Scientific researchers are also using the A.B. Williams archive to assess changes that have occurred over 86 years in the tree community diversity, composition, and structure of the old-growth A.B. Williams Memorial Woods. Undergraduate students, along with their professor, replicated Williams’ methods to resample trees in 58 of his plots. Such re-survey studies are valuable to the field of ecology because they provide the only direct evidence of changes over time in local species diversity and abundance (Sax and Gaines 2003; Kapfer et al. 2017). Other recent studies have used legacy data to gain insights into long-term ecological processes (Vellend et al. 2013; Perring et al. 2018), but few have been long enough to see changes in tree populations and forest communities (Müllerová et al. 2015; Šebesta et al. 2011). The Williams data provides a unique opportunity to observe changes over time in a protected old-growth forest.
In 1932, Williams (1932, 1936) counted, identified, and measured all trees ≥ 0.8-cm diameter in 44 8 × 10-m plots; counted and identified all trees at least knee high in 10 30 × 30-m plots; and counted, identified, and measured all trees at least 2 m tall in 4 15 × 15-m plots. In 2018, we relocated these plots based on the georeferencing described in the previous section and using Williams’s original tree maps, which enabled us to locate remaining individual trees. We counted, identified, and measured trees according to Williams’ methods. We plan to compare stand structure between 1932 and 2018, including stem density, basal area, and the proportions of stems in different size classes. We will compare species richness, diversity, and composition using techniques such as ordination and indicator species analysis. Finally, the observed changes will allow us to examine hypotheses about which factors, such as increased deer density or tree diseases, have driven the development of this forest. We can also assess whether tree species with certain traits have tended to increase in frequency. This study will provide rare insight into how and how much a protected old-growth forest changes over time in diversity, composition, and structure, and will suggest which ecological factors are responsible for the changes. The project provides information useful to basic ecological theory and to applied ecosystem management, including the managers of A.B. Williams Memorial Woods at Cleveland Metroparks, while providing opportunities to mentor undergraduate students in research.
Conclusion
Observations by local naturalists over a long period of time can shed light on seasonal changes. By comparing the data in these historical records with current observations and digitally captured data, scientists can investigate a number of phenomena including the impacts of climate change (Primack and Miller-Rushing 2012; Primack 2014; Ledneva et al 2004). Mining the data contained in historical scientific records has become easier than ever thanks to recent digitization efforts, such as the Smithsonian Field Book Project and Biodiversity Heritage Library, but many sources of historical observations remain hidden and unused in various repositories.
The Discover – Explore – Connect project had many moving parts with three main goals: digitize and make accessible this collection of archival material, create a curriculum for middle and high school teachers, and hold training for educators to learn how to teach using these primary sources in their classrooms and outdoors. From these goals, the project expanded its scope to include other uses for the valuable data contained within the digitized material, including a game, georeferenced maps, and a re-survey of a local forest. Two and a half linear feet of historical records can be developed and used in several different and exciting ways.
Bibliography
Abdul Jabbar, Azita Iliya, and Patrick Felicia. 2015. “Gameplay Engagement and Learning in Game-Based Learning: A Systematic Review.” Review of Educational Research 85(4): 740–779.
Austin, Hilary Mac, and Kathleen Thompson. 2015. Examining the Evidence: Seven Strategies for Teaching with Primary Source. Chicago: Maupin House Publishing.
Dickey Michele. 2005. “Engaging by Design: How Engagement Strategies in Popular Computer and Video Games Can Transform Instructional Design.” ETR&D 53(2): 67–83.
Ermi, Laura, and Frans Mäyrä. 2005. “Fundamental Components of the Gameplay Experience: Analysing Immersion.” In Proceedings of the 2005 DiGRA International Conference: Changing Views: Worlds in Play, 15–27. http://www.digra.org/wp-content/uploads/digital-library/06276.4156.pdf.
Falk, J. H., & Dierking, L. D. 2000. Learning from Museums: Visitor Experiences and the Making of Meaning. Lanham, MD: Rowman & Littlefield.
Hendry, Julia. 2007. “Primary Sources in K-12 Education: Opportunities for Archives.” American Archivist 70 (Spring/Summer): 114-29.
Kapfer, Jutta, Radim Hédl, Gerald Jurasinski, Martin Kopecky, Fride H. Schei, and John-Arvid Grytnes. 2017. “Resurveying Historical Vegetation Data—Opportunities and Challenges.” Applied Vegetation Science 20 (2): 164-171.
Ledneva, Anna, et al. 2004. “Climate Change as Reflected in a Naturalist’s Diary, Middleborough, Massachusetts.” Wilson Bulletin 116, no. 3: 224-231.
Müllerová, Jana, Radim Hédl, and Péter Szabó. 2015. “Coppice Abandonment and its Implications for Species Diversity in Forest Vegetation.”Forest Ecology and Management 343: 88-100.
Perring, Michael P., Markus Bernhardt-Römermann, Lander Baeten, Gabriele Midolo, Haben Blondeel, Leen Depauw, Dries Landuyt, et al. 2018. “Global Environmental Change Effects on Plant Community Composition Trajectories Depend upon Management Legacies.” Global Change Biology 24 (4): 1722-1740.
Primack, Richard B., and Abraham J. Miller-Rushing. 2012. “Uncovering, Collecting, and Analyzing Records to Investigate the Ecological Impacts of Climate Change: a Template from Thoreau’s Concord.” BioScience 62 (February): 170-81.
Primack, Richard B. 2014. Walden Warming: Climate Change Comes to Thoreau’s Woods. Chicago: University of Chicago Press.
Sax, Dov F. and Steven D. Gaines. 2003. “Species Diversity: From Global Decreases to Local Increases.” Trends in Ecology and Evolution 18 (11): 561-566.
Šebesta, Jan, Pavel Šamonil, Jan Lacina, Filip Oulehle, Jakub Houška, and Antonín Buček. 2011. “Acidification of Primeval Forests in the Ukraine Carpathians: Vegetation and Soil Changes over Six Decades.” Forest Ecology and Management 262 (7): 1265-1279.
Tally, Bill, and Lauren B. Goldenberg. 2005. “Fostering Historical Thinking with Digitized Primary Sources.” Journal of Research on Technology in Education 38 (1): 1-21.
Vellend, Mark, Lander Baeten, Isla H. Myers-Smith, Sarah C. Elmendorf, Robin Beauséjour, Carissa D. Brown, Pieter De Frenne, Kris Verheyen, and Sonja Wipf. 2013. “Global Meta-Analysis Reveals No Net Change in Local-Scale Plant Biodiversity over Time.” Proceedings of the National Academy of Sciences 110 (48): 19456-19459.
Williams, Arthur B. 1932. “A Preliminary Study of a Beech-Maple Climax Community.” PhD diss., Case Western Reserve University, Cleveland, Ohio.
Williams, Arthur B. 1936. “The Composition and Dynamics of a Beech-Maple Climax Community.” Ecological Monographs 6: 317-408.
Appendix: Methods
Future usability of the digitized material was maximized through the methods of processing.
- All scans were saved as non-compressed, lossless TIFFs at 600 dpi and then stitched together to create multi-page PDFs, to allow both maximum resolution and perusal.
- Digitizers at BW used an ATIZ BookDrive DIY cradling book scanner, complete with two mounted Canon Rebel T2i 18.0 MP digital cameras and proprietary software.
- Individual documents were scanned on an Epson Perfection V33 flatbed scanner, and an ELMO TT-12i overhead document camera was used to digitize the most fragile documents, such as a scrapbook of cyanotype photograms from 1910-1915.
- Once digitized and converted to PDFs, all applicable text was OCRed via Adobe Acrobat Pro DC and then uploaded to an online collection hosted by BW using OCLC CONTENTdm. Metadata was assigned using Library of Congress Authorities.