Runaway Quilt Project: Digital Humanities Exploration of Quilting During the Era of Slavery
Deimosa Webber-Bey, Pratt Institute School of Information and Library Science
Abstract
The Runaway Quilt Project began with methods and management exercises for a course during library school, archived on a research blog. The initial goal was to use digital humanities tools to explore the plethora of data that exists regarding quilting during the era of slavery, looking for interesting trends and correlations. The “Maker Unknown” quilt preserves the results of research performed during this course. The following year, this endeavor continued with other library school projects, and the goal evolved from simply exploring quilt data to creating a meaningful interpretation and presentation of the information aggregated. The “Maker Known” quilt preserves the data visualizations created during the second year of research.
Introduction
The development of the World Wide Web has had a profound impact on quilting at the turn of this century, as the development of the printing press impacted it at the turn of the last. Before the printing press was invented, quilt patterns were passed from quilter to quilter; after it was invented, quilt patterns were mass distributed in magazines and newsletters. Before the invention of the World Wide Web, quilt research was primarily qualitative, relying on the analysis of surviving pieces in museum collections; since the web’s development, it has become possible to study large swaths of surviving quilts held in museums, as well as those personally owned and itemized in various documentation projects. This presents quilt scholars with a wide range of new opportunities.
My grandmother is both a quilter and a teacher, traits which she has passed down to me. She meets weekly with an informal quilting circle, passing on knowledge and patterns to her peers. We are both members of the Empire Quilter’s Guild, where quilters in the metropolitan area meet monthly for professional development and inspiration. My favorite part of the monthly meeting is a show-and-tell, where twenty to thirty quilts are displayed in rapid succession. Members share recently completed quilts as well as works in progress. These objects of art vary from traditional block patterns in muted tones to innovative uses of color captured in modern abstract designs. Each quilt shown is documented by the guild, and the online gallery of photographs from each meeting expands the audience from those present in the room to anyone with an internet connection. When the meeting is over and this group (of predominantly senior citizens) leaves the meeting, folks on the sidewalk that see these women emerging from the building with tote bags and rolling suitcases have no idea that they are crossing paths with fine artists. The meeting is inspirational.
In my second semester at the Pratt Institute School of Information and Library Science, during an introductory Digital Humanities course, our professor, Dr. Chris Alen Sula, advised that we explore the same topic throughout the semester as we learned various digital tools for scholarship. This lab course taught us how to support twenty-first century scholarship in the humanities as librarians, and since it was my opportunity to engage any topic I desired, I decided to study African American quilting in the nineteenth century and use a blog, which I named the Runaway Quilt Project, to enable public interaction and feedback. This project eclipsed the one semester and eventually took center stage during my time at Pratt, and this article reflects two years of experimentation with digital humanities tools.
Trained as both an African and African American Studies scholar and a quilter, I am intrigued by the myth that quilts were used as signs on the Underground Railroad, and I am more than aware of the controversy that surrounds it. In fact, I avoid taking sides; as an African American female quilter I want to believe that women in slavery and their quilting peers on the outside were capable of such acts of resistance, but as an academic I know that there is no smoking gun/quilt and that the case against this legend has been well established. However, I chose to create digital objects that tell the story of quilting during the era of slavery so that I understand the context of this debate, and the resulting materials neither support nor refute the myth. These digital objects serve as a foundation for exploring trends in the data and developing research questions.
The tools and experimentation process take central stage in this narrative because the main purpose of each exercise was to learn how to create a digital object for a class assignment. Sometimes a later assignment allowed me to explore an idea or discovery in more depth, and at other times the research pursued a tangent or jumped into something new. At the end of each year, following discussions surrounding the preservation challenges of digital research projects, I created a tactile object – a quilt – that captured information and visualizations that could be represented on a two-dimensional surface. This allowed me to archive my research and share it with a non-academic audience, such as during the show-and-tell at the Empire Quilt Guild meeting. Ultimately, I entered these archival quilts into the International Quilt Festival to share my experience and use these objects of interest to drive traffic to the research blog that contains two years of work. This provides me with a critical mass of views so that I can eventually evaluate the blog and research process using altmetrics.
Altogether, this article privileges process over product. At the beginning, I examine the background for this research, including Brackman numbers, digitization projects, and the myth of a quilt code. This leads into textual analysis and introduces Gracie Mitchell, a quilter and ex-slave interviewed by the WPA Federal Writers Project in 1938. I present the experiments that were inspired by Mitchell’s interview transcript individually, with a brief discussion of the digital object at end of each section; they are not analyzed in full because my intention is to show rather than tell. At the end of this paper, I discuss documentation, preservation, and sharing, and I introduce the revised data quilt that preserves my work.
Background
In his seminal essay, “English and the African Writer,” Chinua Achebe discusses the use of English for communication:
The African writer should aim to use English in a way that brings out his message best without altering the language so much that its value as a medium of international exchange will be lost. He should aim at fashioning an English that is at once universal and able to carry his peculiar experience. I have in mind here the writer who has something new, something different, to say. (Achebe 1997, 347)
In the twenty-first century I interpret this charge to now include the use of HTML, the medium of international exchange on the World Wide Web, and so I attempt to use the tools of Digital Humanities to say something new and different about my particular experience as an African American quilter. The simple informational displays created for this project constitute practice for me, preparing me for future in-depth research.
Data visualization and the African & African American studies scholar
The week that we learned to use Tableau Public, a free data visualization tool, I created a digital object that has nothing to do with quilting, but everything to do with my interest in resistance during slavery. I turned to the Voyages Trans-Atlantic Slave Trade Database, where there are 34,946 records in the “List of [slave] voyages” from 1514 to 1866. The website enables users to create visualizations, but users can also create and download custom tables, so I downloaded a table with only the data for voyages where the slaves resisted their captors. I experimented with several different chart configurations before I settled on a bubble map:

Figure 1. Bubble map for resistance during Middle Passage
Left to right shows the continuum of days during middle passage, the size of the circle markers show how many slaves were on a ship, and the color indicates what country the slaves are from. Interesting questions that emerge from the data visualization include:
- Why did slaves from Senegambia (pale green) who resisted tend to rebel on the first third of the voyage?
- Why did slaves from Bight of Benin (dark orange) who resisted tend to rebel during the second half of the voyage?
- Why did slaves from Sierra Leone (purple) and the Windward Coast (lavender) who resisted tend to rebel about fifty days into Middle Passage?
Creating this visualization gave me good practice with Tableau Public, and this example demonstrates the potential for using data visualizations to develop research questions.
Quilt digitization and documentation projects
The exciting part of exploring this subject in the digital humanities realm is that, with the affordances of the Internet and quilt documentation projects, particularly the Quilt Index, I was able to sit at my desk and download data for thousands of quilts. Before, conducting this work might have required a lifetime of traveling to museums and private homes to collect information. Since museums and research collections have posted their collections online and hosted documentation days, where private quilt owners bring in quilts to be photographed, dated, and sometimes placed geographically, the Quilt Index has been able to collect these virtual collections in one place on the web. This allowed me to build on their work and to create data visualizations and interactive digital objects that I and the public can explore, looking not for answers, but for interesting trends that led to new research questions and serendipitous discovery.
Brackman numbers
Many of the quilts in the Quilt Index and other archival collections are tagged with a Brackman number, from Barbara Brackman’s Encyclopedia of Pieced Quilting Patterns, which provides authority control for cataloging. This encyclopedia standardized the classification of quilts in 1993. Previously, patterns might be described in many different ways, but Brackman (1993) divides patterns into 25 categories, “classified and grouped into categories on the basis of the basic unit of design and the way it is repeated (its repeat). These visual categories are usually defined by seam lines that organize designs into types” (13). According to Janice Price (2011), Collection Manager at the International Quilt Study Center and Museum and a graduate of University of Nebraska-Lincoln’s unique quilt emphasis program, Brackman numbers are universal identifiers understood in the entire quilting domain. Brackman’s The Encyclopedia of Pieced Quilting Patterns and The Encyclopedia of Applique are considered the essential guides, with the potential to make databases interoperable. When quilt archivists are cataloging a quilt with no know title, location, or quiltmaker, eliminating the question of author or title entry, they begin by dating it within a twenty-year range. To do this curators identify patterns using the 1” x 1” pictures in Brackman’s encyclopedia. They then examine the fabric and its colors, as well as whether the item was machine-stitched. Price acknowledges that dates change frequently as quilt historians make new discoveries. The quilt revival has been able to cope with the explosion of quilt documentation due to the affordances made possible by Brackman’s meticulous work.
The myth of a quilt code
One subject that has occupied popular conversation in the quilt domain since the 1996 publishing of Hidden in Plain View is the theory that quilt blocks were used for a code system in the Underground Railroad (Tobin 1999). Jacqueline Tobin advances the idea that different block patterns had unique meanings and that when the quilts were hung outside on clotheslines, fences, and porch railings, runaway slaves potentially interpreted the coded messages and acted accordingly. This controversial theory has two camps: one which asserts that there is no proof, and one which believes that this act of resistance is obvious, particularly due to the lack of proof, because success required discretion. It therefore occupies what Mary Louise Pratt refers to as a “contact zone,” the space between oral history and the written record, where these two distinct camps meet, clash, and grapple with each other (Sharpe 2003, 4). An example of this is the March 2003 Traditional Quiltworks article, “Betsy Ross redux: the Underground Railroad ‘Quilt Code,’” expanded into an e-book on the author’s website, where Leigh Fellner (2006) meticulously refutes the details included in Hidden in Plain View and devotes space to a “Hall of Shame” for “A seemingly endless cavalcade of retailers (almost exclusively white) who use slavery, African-Americans, and the ‘Underground Railroad Quilt Code’ as a marketing tool.” However, in this current global culture, picture books such as Sweet Clara and the Freedom Quilt, in which a slave creates a map quilt with the Underground Railroad route stitched onto its surface, and the proliferation of quilt code lesson plans on the Internet, ensure that this idea will persist into subsequent generations and feed popular consumption (Sharpe 2003, 40).
Jenny Sharpe (2003), in Ghosts of Slavery, argues that in the absence of written information historians are forced to turn to oral histories to examine conjecture and understand what may have happened, so it is important to note that the data that I use for this project is incomplete (25). The quilts that have survived and inform this research represent a fraction of the quilts and quilters that were active in the era that I am studying. The experiments that I conducted with this data are as significant for what they do not say as they are for what they do. Like Sharpe, I am using an incomplete dataset to better understand a subject we cannot definitively know, since both the quilts and the narratives of slaves cited in this study represent the fraction that have survived the passage of time. Sharpe (2003) writes:
Rather than equating a black female subjectivity with individual consciousness or modes of self-expression like songs and testimonies, I locate it between written and oral histories, first-person and third-person accounts, pro- and antislavery writings, and at the point where the unspoken narratives of everyday life intersect with the known stories of slavery. In noting the inadequacy of language, I also denote the limits of this study as an effort to describe the everyday lives of female slaves, about which we have much to learn but can never fully know (xxvi).
I have been aware of the controversy regarding whether or not quilts were used as signposts on the Underground Railroad for years, so rather than ascribe to the arguments of either side, I used this opportunity in library school, learning tools for twenty-first century scholarship, to research quilting during and directly after the era of slavery within the general American and specifically African American population. Recognizing my limits, as Sharpe does, my goal was to create objects that stimulate conversation so that I can learn from scholars and quilters alike, facilitating serendipitous discovery and recording the cultural knowledge possessed by my grandmother and her quilting peers.
In Ghostly Matters, Avery Gordon (2008) writes about the need to investigate “that which makes its mark by being there and not there at the same time,” and the goal of the Runaway Quilt Project is not to prove or disprove a legend passed down through oral tradition (6). My objective is to understand the context of this legend while contributing empirical information to the field of African American and quilt scholarship that facilitates quantitative analysis for a variety of academic inquiries. At a minimum, quilting allowed African American women a form of artistic expression during a time of subjugation and dehumanization, and as Saidiya Hartman cautions, we should not “overestimate the subversiveness of everyday acts of resistance in the face of terror and cruelty suffered by slaves and the constraints placed on their agency” (quoted in Sharpe 2003, xv). However, the overwhelming appeal of the idea of a quilt code to the human psyche creates not only a hook or point of interest for this research exercise; it also offers an opportunity for future investigation into how slave myths and legends formed, as well as how they inform African American culture today. As Gordon (2008) writes:
[A]ny people who are not graciously permitted to amend the past, or control the often barely visible structuring forces of everyday life, or who do not even secure the moderate gains from routine amnesia, that state of temporary memory loss that feels permanent and that we all need in order to get through the days, is bound to develop a sophisticated consciousness of ghostly haunts and is bound to call for an “official inquiry” into them (151).
African American quilters have not been allowed to enshrine this everyday act of resistance into the historical record because of its foundation in oral tradition, a lack of concrete evidence, and details that may have become exaggerated over the passage of time. Yet, the persistence of this legend required me to address it, since it has become enshrined in the narrative of popular culture, and my opinion on this controversy is, and will continue to be, a question frequently asked by family, friends, peers, and colleagues. My answer has to be informed.
Oral history and digital annotation
For our first foray into digital humanities, we explored digital annotation, and I decided to take advantage of the Library of Congress’ online American Memory collection. During the 1930s, the Works Progress Administration conducted interviews with African Americans who were former slaves. Searching for the keyword “quilt,” out of over 2,300 interviews, which were digitized for Born in Slavery: Slave Narratives from the Federal Writers’ Project, 1936-1938, I found that 156 (6.78%) mention quilting (Library of Congress Manuscript Division 2001). Over the course of a week, I read each of these interview transcripts and themes began to emerge. As I transcribed, I divided the quotes into categories:
- Quotes from (or about) specific female slaves who quilted
- Quotes that explain how quilts were made
- Quotes that describe how quilts were used
- Quotes from anecdotal stories where quilts are mentioned
- Quotes about a term that was new to me – the “quilting party”
To share this work in an interactive forum, I created a Digress.it website, where users can comment on each quote individually, engage the text, debate interpretations, and make their own meaning of the text. These brief mentions of specific patterns, methods, and hanging out at a “quilting” late into the night, show that the craft was economically, socially, and politically essential to the community. Unfortunately, Digress.it seems to no longer be a functional website, so I created pages on the blog that list the quotes by topic, but users will no longer be able to comment at the paragraph level. One transcript that caught my immediate attention was that of Gracie Mitchell, interviewed in Pine Bluff, Arkansas. Like an Empire Quilter, Mitchell conducted a show-and-tell with her captive audience, interviewer Bernice Bowden. In the notes for Mitchell’s interview, Bowden included a list of the twenty-two quilt designs that Mitchell showed her on that day (Mitchell 1938). This list, and Mitchell’s transcript, became central to my research experience, influencing the direction of further inquiry.
English literature and line graphs
The Google Ngrams tool measures how often phrases occur in books scanned as part of the Google Books project, and so I looked at terms related to large gatherings of slaves, such as “cornhuskings,” “log rollings,” and “quilting parties,” as well as quilt block names. These were analyzed in relation to relevant time periods and terms, such as “runaway slave” and “underground railroad,” and presented as graphs with observations.
To begin with, quiltings, candy pullings, log rollings, and corn shuckings were significant social gatherings identified by ex-slaves interviewed for the Federal Writers’ Project in the 1930s. Explaining “quiltins,” three interviewees state that, with permission from their masters, slaves were able to attend a quilting at another plantation, which presented a significant opportunity for socializing and the communication of ideas (Avery 1936, 3; Davis 1938, 9; Mullen 1936, 3). Regardless of whether they were intentionally subversive gatherings, the presence of alcohol and limited oversight is significant. The “quilting party” also figures significantly in 19th century American texts, as shown in Figure 2 below.

Figure 2. English quilt term variants 1800-1900 (sm=5)
This chart shows that the most popular way to refer to the event being discussed was “a quilting,” followed by the plural version “quiltings.” Both of these use the string of letters q-u-i-l-t-i-n-g as a noun, and its use as a noun is far more popular than its use as an adjective to modify “bee” or “party.” Investigating the sources scanned in Google Books that make up this data confirms that in the phrases “a quiltin” and “a quilting,” q-u-i-l-t-i-n-g is being used as noun, not a verb or adjective. A quilting was its own significant categorical event in the American psyche. All of the terms occur less frequently in British English publications, and both “quilting party” and the informal variant “a quiltin” are absent altogether, as shown in Figure 3 below.

Figure 3. 19th century British English quilt gathering term variants (sm=5)
This chart indicates that audiences for “quilting parties” and “quiltins” are unique to the American population. The “quilting party” is mentioned more in nineteenth-century American print publications than any of the terms in British print. Returning to Figure 1, it shows that these American phenomena were first mentioned in print in 1820.
- The phrase “quiltin” peaks in American print in the 1840s (~0.000000850%) and “quilting party” in the 1850s (~0.000001750%).
- The phrase “quiltings,” the most frequently occurring variant in British print, was most popular in the 1830s (~0.000001600%).
Filtering out British publications, I analyzed the terms to examine the American experience (Figure 4).

Figure 4. American English quilt gathering term variants (sm=3)
- Most of these variants show a rapid increase in American print usage of the terms between 1820-1850.
- The phrases “quiltin,” “quiltings,” and “quilting party” slowly decrease in occurrence in American print throughout the twentieth century.
- The “quilting bee” replaces “quiltin,” “quiltings,” and “quilting party.”
The phrase “a quilting” sees revival and growth beginning in the 1970s, but investigating the Google Books used for the data set shows that, for the latter half of the twentieth century, quilting is used as an adjective in these occurrences, not as a noun. Falling out of usage first is “a quiltin,” hitting a low during the 1920s and never recovering. The phrase “quilting party” occurs about as often in the 1940s as it does in the 1850s, holding consistent for roughly one hundred years before a steep decline in the 1950s. The pluralized noun “quiltings” decreases in popularity beginning in the 1880s and continues to decrease throughout the twentieth century. Social quilting gatherings by these names have a life span of about 140 years, likely their audience did as well – meaning that the quilters who used this specific term were a distinct group of women born in the mid- to late-nineteenth century, who died in the early to mid-twentieth century without passing on the specific habits related to this term to the next generation of quilters. In the span of one generation, these particular nineteenth century American quilters, a phenomenon occurred that did not exist before, and it has since faded from collective discussion. If they didn’t pass down the term or practice of “quiltings” to their daughters, then we can infer that there is related information that was also lost.
Searching for quilt needles in a haystack
While the correlation between English literature and African American quilters is slim, curiosity required that I look for the frequency of use for phrases that are associated with the Underground Railroad quilt code legend. Figure 5 shows the introduction of related phrases into American English texts.

Figure 5. American English URR Myth (sm=1)
- The uniquely American social gatherings to finish quilts predate the popular phrase “Underground Railroad,” but not the act of resistance embodied in the phrase “runaway slave.”
- The two Google Books showing “Underground Railroad” mentioned in 1800 are incorrectly dated and are actually from 1860 and 1890.
As Figure 6 indicates, of any social gatherings for slaves with the potential for planning such an endeavor, a “quiltin” or “quilting party” are the most significant.

Figure 6. Terms for slave gatherings in American English during the URR (sm=0).
Looking at the events surrounding significant bumps on this chart:
- The Fugitive Slave Act of 1850 requires that runaway slaves be returned to their owners.
- In 1854 the Republican Party forms.
- In 1857 the Dred Scott decision states that the Bill of Rights does not apply to slaves.
- In 1858 Abraham Lincoln, nominated by the newly formed Republican Party, runs for Senate.
- In 1860 Abraham Lincoln is elected President of the United States.
- January 1, 1863, President Lincoln signs the Emancipation Proclamation.
After looking at significant terms for slave gatherings, I examined phrases used to describe quilt gatherings, the act of resistance, and pieced quilt block patterns that were included in Bowden’s interview notes for Gracie Mitchell. Of particular note, in the WPA slave narrative interview with Walter Rimm, he describes a quilting party where a runaway slave escapes a trap set for him by patrollers, yelling “Bird in de air!” into the night as makes his getaway (Rimm 1936-1938, 2). This is of particular note because the “bird in the air” or “birds in the air” pattern is one of the quilt block patterns most frequently associated with the Underground Railroad quilt code myth. It is theorized that this pattern (aligned triangles) was hung on a railing, porch, or clothesline, with the triangles aiming North, South, East or West, so that escaped slaves could determine which direction to go. It does not prove anything, but the fact that a slave yells this particular phrase while running away from a quilting party is both interesting and significant.
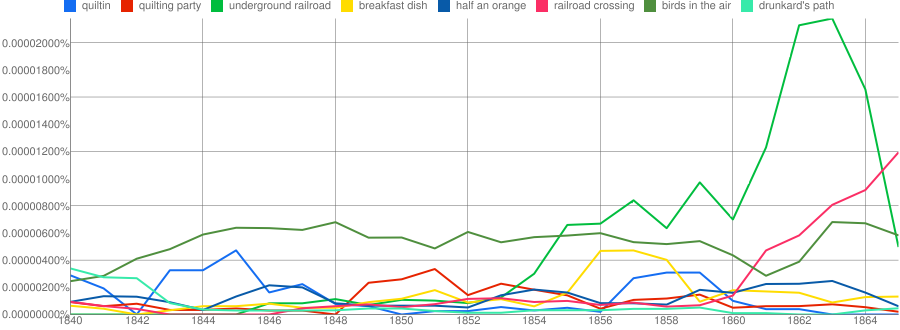
Figure 7. URR terms and quilt patterns in American English (sm=1)
The theory of a quilt code has many enthusiasts, but no concrete evidence. Quilt historians and Underground Railroad scholars have disputed and criticized the idea since it came to light. An examination of the relative occurrence of all social slave events and acts of escape shows that quilt gatherings had the most potential for the correlation of activities, and looking at the quilt patterns associated with the myth demonstrates that the phrases “railroad crossing,” “breakfast dish,” “birds in the air,” and “half an orange,” are significantly used in the decade prior to Emancipation. However, figure 7 does not offer any compelling circumstantial evidence that would support or refute claims that these patterns were used for a quilt code.
Gracie Mitchell: Snapshot of an African American Quilter
I created a timeline for Gracie Mitchell, using Timeline JS, in order to present an interactive object that gives context for the era during which she lived. In addition to dates from her life that she described during the interview, I researched the significant dates for the quilt patterns that she showed her interviewer in 1938. Copying the template provided by the Timeline JS site, I created a Google Sheet with time-series data related to details from Gracie Mitchell’s interview transcript, where the Bernice Bowden included two pages of notes. While one notes page lists all of the quilts that Mitchell showed Bowden that day, another page lists details such as the exact duration of Mitchell’s residence in each state and the years that she moved. Following that, I researched relevant historical items (including still images, audio, and video) for each time span, topic mentioned, or location lived in, and placed it in the appropriate place chronologically. I set the timeline to begin with the date she was interviewed, so that to read it the user has to go backwards in time from 1938. This software is easy to use and produces digital objects that are simple to navigate.

Figure 8. Timeline for Gracie Mitchell
Geospatial mapping – part one
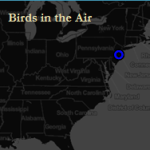
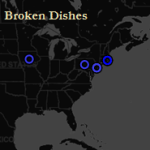
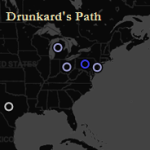
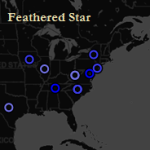
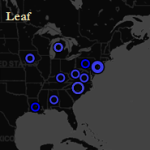
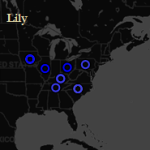
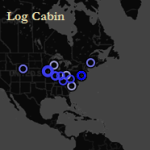
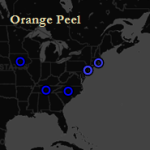
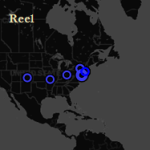
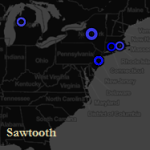
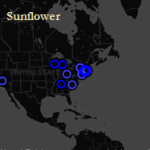
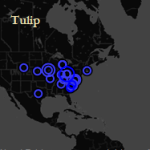
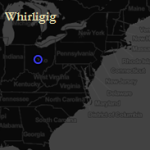
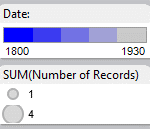
For our first foray into mapping I used the Leaflet Maps Marker tool (a WordPress plug-in) to create interactive maps of 19th century quilt pattern occurrences, relying on data from the online collection of the International Quilt Study Center and Museum. Gracie Mitchell’s interview transcript provided me with a thematic grouping of quilt patterns to work with, and each map uses one of Leaflet Maps Marker’s symbols to represent a quilt pattern. The symbols are placed where the quilt was made. Clicking on the symbol provides a pop-up window with metadata for the particular quilt, and the aggregated map, shown in figure 9, depicts all of the maps layered together.
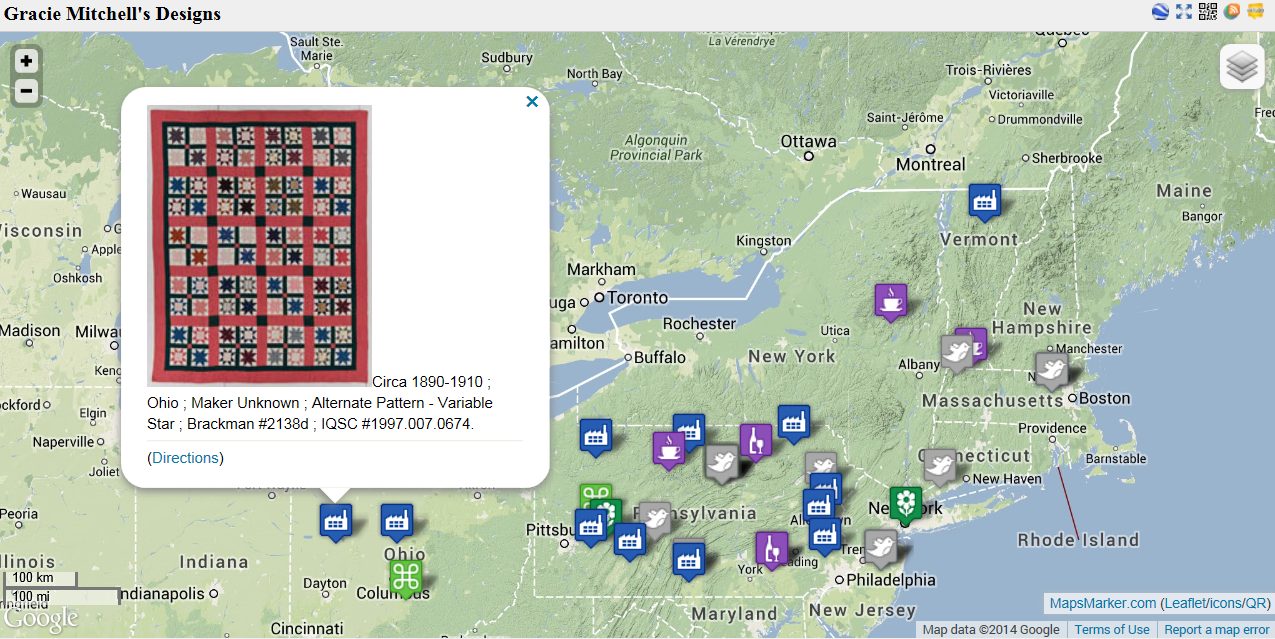
Figure 9. Aggregate map of 5 Gracie Mitchell designs
One constraint of this activity at the time that I worked on it was that only five of Gracie Mitchell’s quilt patterns were mapped. Of those that were mapped, most of the occurrences are concentrated in the Northeastern United States.
- Broken Dishes: The earliest example of this design is from New England, circa 1860-1880.
- Sawtooth: This is the second pattern design listed in the 1938 interview record. There is one early quilt (circa 1830-1850) that was produced in Alabama. However, most of the pattern occurrences (including the earliest, circa 1820-1840) are in modern day Pennsylvania; 19th-century quilters were likely inspired by the rugged terrain of the Appalachian Mountains.
- Tulip Appliqué: Gracie Mitchell referred to appliqué as “laid work.” This design made it to Indiana by 1860.
- Cactus: Because Gracie Mitchell called the design she completed “Prickle Pear,” it is possible that she appliquéd the design. However, the interviewer did not list “appliqué” or “laid work” as she did for other pieces that used that method.
- Birds in the Air: This pattern is has a strong affiliation with the quilt code myth, and the phrase is used significantly in an ex-slave’s interview, as noted earlier. Ms. Bowden lists it as “Birds All Over the Elements” in the interview transcript.
This mapping exercise was both intriguing and frustrating, as it had incredible potential for analysis, but I was not working with the ideal tool. One year later I would return to this problem.
Network analysis
For my final Digital Humanities class project in the spring of 2012, I decided to preserve the data I curated during the project (Jan-May 2012) on a quilt top. Using Cytoscape, open source software for visualizing networks, I created a frequency map of the quilt block patterns that were mentioned by Gracie Mitchell in 1938 and also existed in the 19th century. The size of the block shows how often the quilt pattern occurs in the IQSCM collection. The colors of the log cabin block, the largest square (one side of the quilt), represent the five types of quilts. The quilt is framed with a border that provides the source code for the home page of the project website in May 2012, and the hanging loops around the edges represent the ethnicities of the women working together on an object at a quilting party. The network of quilt blocks is constructed by hand and by machine, using multicolored thread.
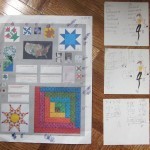
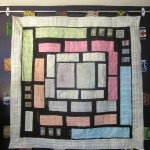
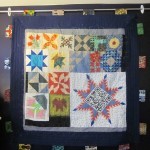
Figure 10. Planning notes, quilt front (log cabin block with quotes), and quilt back (remaining blocks)
To finish the quilt, I held a quilting party with some of my female friends, and after presenting in the quilt in class and at the Pratt SILS Student Showcase, I entered it in the show-and-tell at the Empire Quilters’ meeting in May 2012.
Documentation
I created a video to capture the process of creating this quilt, titled Maker Unknown because 81% (141 out of 175) of the nineteenth-century quilts used for research in this project were listed in the IQSCM catalog as “Maker Unknown.” The quilt is dedicated to the slave women who labored as quilters, creating art for everyday use, and to all post-Emancipation quilters and quilt enthusiasts who keep their legacy alive.
- The quilt was constructed in April and May 2012 in New York City (Brooklyn and Queens).
- The quilt blocks were pieced by Deimosa Webber-Bey (Log Cabin, Tulip Appliqué, Orange Peel, Reel, Railroad Crossing, Tree of Life, Sunflower, Birds in the Air, Bird’s Nest, Ocean Wave, Drunkard’s Path, Leaf) and her grandmother, Marian Webber (Feathered Star, Carolina Lily, Sawtooth Star, Broken Dishes, Cactus, Whirligig).
- The Log Cabin block was made by printing the data and images aggregated during the project, as well as the QR and source code for runawayquiltproject.org, onto fabric treated with Bubble Jet Set.
- Quilting around the data strips on the Log Cabin block was done by hand in variegated thread by Tiana Grimes, Erica Schwartz, and Deimosa Webber-Bey at a quilting party, in keeping with nineteenth-century construction techniques; the hanging loops represent enslaved nineteenth-century quilters sitting around a quilt, and they are made from African (15/16) and Native American (1/16) fabric (in 9 out of 156 interviews used for this project, the ex-slave identified Native American heritage).
- The information on the Log Cabin block faces out from the center in all directions so that it is best engaged when placed on a table, with observers seated around it making their own meaning of the information presented.
- There is a suggested citation on the quilt top.
Ego network
During the spring of 2013, I took Dr. Sula’s Information Visualization course, and I returned to the problem of network analysis. For this visualization experiment I retrieved a dataset from the Quilt Index by searching for quilts made in the different geographic locations where Gracie Mitchell lived when she lived there. Her interviewer, Bernice Bowden, recorded the places where Mitchell lived during her life and the years that she lived in each. The result is a sample dataset of quilters, her contemporaries, and the patterns that were being made around her, by her contemporaries, throughout her life. While Gracie Mitchell’s quilts may not have physically survived, their occurrence – or instantiation – was documented by an authority, so the goal of this ego-centric network was to create a digital object that shows the context in which Gracie Mitchell quilted and chose the twenty-two patterns that she executed.
First, using Cytoscape, I uploaded the column with locations as the source, the quilter column as the interaction, the pattern column as the target, and the year column as an edge attribute. Then, in the Custom Graphics Manager pane I added a Sawtooth Star icon to the list. I changed all of the nodes to Sawtooth Stars, except for the locations, for which I found public domain state icons, and I changed the font to Courier, which resembles the typeface used in the WPA narratives. Then I selected the degree-sorted circle layout, so that Cytoscape would run a calculation that would allow me to use degree as a node attribute.
Next I chose to use the date attribute for continuous mapping of the edge color. This allowed me to create a gradient that identifies the period when the quilt was made; I chose to leave the edges black for quilts made during the era of slavery. Then I changed the node sizes so the degree of magnitude is 10x their in-degree number and the location node sizes are 10x the number of years that Gracie Mitchell lived in each place. I also changed the edge line style for Gracie Mitchell to dashed lines and the edge line style for all of the other quilters to dotted lines. At this point I made minute manual adjustments to the positions of a few nodes in order to minimize the overlap from the node labels. I shared my network with a few friends to get a sense of readability and what story it was telling, and I got a suggestion to position the locations relative to each other as they are geographically.

Figure 11. Edge weighted force directed layout
I was concerned that the network gives the impression that all of Gracie Mitchell’s quilts were made in 1938, so after manipulating the nodes awhile, I settled on placing the geographic place names in the center, Gracie’s quilts in an inner circle (degree sorted), and the quilts made around her in an outer circle (sorted alphabetically). This places Gracie in the center of the network and shows how the quilt patterns she chose fit into the larger context of where she was living and how she was influenced by the quilters around her. The network visualization depicts the patterns created in the states where Gracie Mitchell lived while she was there. The lines represent each quilter that executed the pattern and the line colors indicate the year the quilt was made.

Figure 12. Ego centric quilt network
With a growing sense of my final project for Information Visualization looking like a Reconstruction era American flag, I created an ego network with a circular layout, placing the Quilt Index data on the outer ring, Gracie Mitchell’s twenty-two designs in an inner ring, and the three residences in the center. The visualization infers the following:
- Gracie Mitchell probably became familiar with certain patterns, such as the Feathered Star, Sawtooth Star, Log Cabin, and Sunflower, while living in Texas, where she resided until she was almost 40.
- She possibly learned how to do the Tree of Life pattern while she was living in Chicago for eight years.
- Only the Orange Peel overlaps with work that has survived from Arkansas.
In comparison with other quilters of her location and era, you can infer that her pattern selection was influenced by her experiences in other states. But the fact that very few of her designs overlap with contemporaries’ shows that she was experimental, and perhaps one of the first in her area to purchase a book of patterns. She does state that she had a book of patterns in her interview, lent to a friend and never returned (Mitchell 1938, 2).
Big Data and Its Affordances
At the beginning of the 2013 spring semester, I decided to use a more comprehensive database, the Quilt Index, to continue the project. The Quilt Index is somewhat comparable to WorldCat, in that it is a compilation of records from many different quilt collections. It is a free, open-access project of Matrix, Michigan State University Museum, and the Quilt Alliance. There is less consistent metadata, but the pattern name and year are almost always present, which is essential to the interactive map problem that I was working on. Using the search tool, I was able to construct large comparison tables for item records, and then copy and paste them into Excel. After bringing the file into Google Refine, a software program for cleaning messy data, I was able to enforce a controlled vocabulary for the quilt pattern names in about 750 item records and format all of the dates similarly.
Using Google Refine, I clustered/merged the patterns and quilter names and then clustered/merged the dates as text facets in order to delete the “c” for circa in front of some dates and turn date ranges like “1860-1890” into the earliest potential occurrence (“1860”). After that I transformed the column into dates. After some additional cleaning, I was able to make several linked datasets available openly through Google Sheets.
Geospatial mapping – part two
Now that I had a significant dataset, occurrences of the twenty-two patterns Gracie Mitchell used during the years 1800-1849, I transferred it to a Google Fusion Table. With this brand new tool, I was able to view the quilt pattern occurrences on a full screen map and share a link where others could zoom in and out, and they would finally be able to filter by pattern! This was an improvement over the WordPress plug-in that I used during spring 2012, which only allowed me to add markers one at a time (and I never finished building the layers for all twenty-two patterns). The map shows all of the patterns with a different icon, and the user can zoom in and filter. Regarding icons, I chose images that somewhat related to the name of the pattern (for example, “drunkard’s path” is represented with a martini glass), but the best imagery for this map would be the actual quilt blocks. As this map is very cluttered, I knew that in the end I would be making small multiples in order to facilitate analysis of the data.
Geospatial mapping – part three
Returning to my mapping challenge once again, I used Tableau Public to create an individual map for each block pattern. Initially, I had a complex spreadsheet and cluttered maps, but I decided to only show the oldest instances of the quilt pattern documented in the quilt index (roughly ten or fewer data points) so that users can consider the possible geographical origin for each design. They can also compare the designs to each other, getting a sense of what patterns are the oldest in the dataset.
After uploading my dataset with 171 records into Tableau, I had to clean it. If the location for where a quilt was made was not clear in the full item record (in the “location,” “provenance,” “quilt history,” or “quiltmaker address” fields), then I entered a location based on the address of the owner (usually a relative/descendant of the quiltmaker), the person who brought the quilt in for donation or documentation. There were about a dozen instances where I entered the location of the contributor (to the Quilt Index) or the quilt collection. Next, I uploaded the file into Tableau and created a map visualization using the pattern field, which gave me horizontal maps. I used the pattern field again to create columns, which gave me a grid with square maps. The ones that I needed were in a diagonal from the top left of the visualization to the bottom right, so, using Microsoft Paint, I cropped screen shots of each pattern map for small multiples:


Overall I was pleased with the way that the maps turned out. Some of them are dense, and in order to fit them in the same size square you lose readability (such as with the Log Cabin, Sunflower, Tulip, and Reel), but it is a worthy sacrifice for the overall effect. I was able to save my visualization to the web with Tableau, and embed the maps into my blog.
Heat map
In order to get a sense of the popularity of each of the twenty-two patterns over time, I retrieved a dataset from the Quilt Index that spanned 1840-1940 – the 100 years prior to Gracie Mitchell’s WPA interview. Using Google Refine, I made authoritative choices for pattern names and dates (changing circa spans to a specific year), and then, using Tableau, I created a heat map with the data presented in five year “buckets,” where color codes frequency in the matrix.
Documentation
At the end of the spring 2013 semester, I aggregated final versions of the information visualizations into a whole cloth design for a quilt, a second draft of the “Maker Unknown” quilt that I constructed the previous spring, and had the design printed onto fabric. This textile object and infographic is a more thoughtful execution of my research into Gracie Mitchell, and so it is named “Maker Known.” I decided to approach this infographic quilt with three questions:
- How was Gracie Mitchell influenced by the quilt(er)s around her?
- What is the geographical origin for each pattern?
- How popular were each of these designs during the final decades of slavery in the U.S. and during Gracie Mitchell’s lifetime?
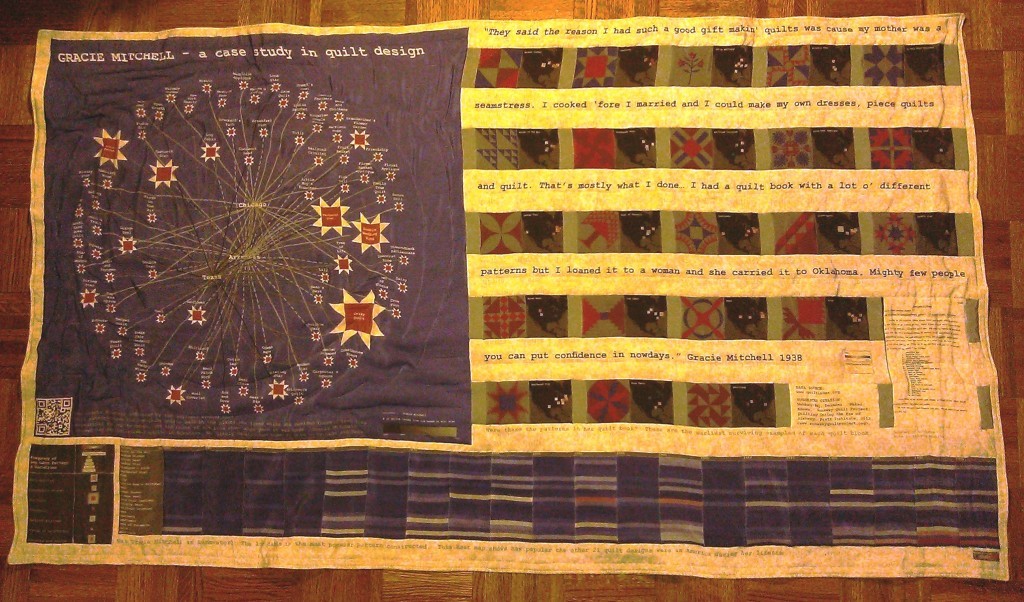
Figure 13. Data quilt 2.0 – “Maker Known”
The overall data quilt is designed to resemble a Reconstruction-era flag, and the colors used are hues of red, white, and blue, where red is consistently used to emphasize significant data and the background white is a word cloud generated with Wordle from the RQP digital annotation exercise. The heat map runs across the bottom of the data quilt top, adding to the flag impression with more horizontal stripes. The heat map shows the frequency with which twenty-one of the twenty-two patterns were made; the log cabin pattern occurs the most frequently, making up almost half of the items retrieved for the data set, so it is highlighted with its own chart, separated from the heat map because it is an outlier and heavily skews the visualization when included. In the heat map a vibrant red codes high frequency and dark blue codes low frequency. In the chart for the log cabin, like the small multiple maps, red codes an item as older, blue as newer, and size codes frequency.
Overall this infographic quilt represents using data to place the historical figure Gracie Mitchell in context. The visualizations show that she was experimental and executed several quilt designs that were established patterns, but not frequently made by her contemporaries. She also created a few quilt tops that demonstrate her familiarity with traditional patterns that existed during the era of slavery and continued to be popular throughout her lifetime. I quilted the final tactile object at home, by machine, and then submitted this quilt and “Maker Unknown” to the International Quilt Festival.
Conclusion
Ultimately, “Maker Known” was accepted into the International Quilt Festival, and the quilt traveled from August 2013 to August 2014. In the fall of 2013, I traveled with my sister and grandmother to the show in Houston, Texas, where I saw my quilt hanging in one of the most highly esteemed quilt shows in the field. While I still feel that I am an amateur quilter, I know that the piece earned its place because of the eighteen months of research and design that went into it. It was important as well, as a personal accomplishment, to share the experience of traveling to Houston to see my work in the show with my grandmother in her eighty-fifth year. This is my proudest achievement to date.

Figure 14. “Maker Known” at the International Quilt Festival in Houston, TX
Now that the quilt has been returned, it is my hope that traffic to the blog will continue and that readers will comment on and annotate the digital objects. These second, third, and fourth sets of eyes may identify ghosts that I could not see in the data. Ideally, this research will engage quilters as well as digital humanists and African American Studies scholars, whose knowledge of the craft can piece together the past and unleash the imaginative force of what might have been (Sharpe 2003, xii). These conversations will inform my future research.
Bibliography
Avery, Celestia, interview by Minnie B. Ross. 1936. Born in Slavery: A Few Facts of Slavery (November 30). OCLC #47265597
Brackman, Barbara. 1993. Encyclopedia of Pieced Quilt Patterns. Paducah, KY: American Quilting Society. OCLC #27812938
Davis, Minnie, interview by Sadie B. Hornsby. 1938. Plantation Life as Viewed by an Ex-slave. OCLC #47265597
Fellner, Leigh. 2006. “Betsy Ross redux: the Underground Railroad “Quilt Code.” Hart Cottage Quilts. http://ugrrquilt.hartcottagequilts.com/ (accessed September 20, 2014).
Gordon, Avery. 2008. Ghostly Matters: Haunting and the Sociological Imagination. Minneapolis: University of Minnesota Press. OCLC #232663637
Library of Congress Manuscript Division. 2001. Born in Slavery: Slave Narratives from the Federal Writers’ Project, 1936-1938. Washington DC, 2001. OCLC #47265597
Mitchell, Gracie, interview by Bernice Bowden. 1938. Born in Slavery: Arkansas Narratives, Volume II, Part 5 (November 1). OCLC #47265597
Mullen, Mack, interview by J.M. Johnson. 1936. Born in Slavery: Mack Mullen (September 8). OCLC #47265597
Price, Janet, interview by Deimosa Webber-Bey. 2011. Collection Manager, International Quilt Study Center & Museum (November 1).
Rimm, Walter, interview by WPA. 1936-1938. Born in Slavery: Ex-slave stories (Texas). OCLC #47265597
Sharpe, Jenny. 2003. Ghosts of Slavery: A Literary Archaeology of Black Women’s Lives. Minneapolis: University of Minnesota Press. OCLC #50479199
About the Author
Deimosa Webber-Bey, MSEd MSLIS, is a librarian and educator with a passion for young adult literature, graphic novels, postcolonial subjects, and quilting. An undergraduate English and African & African American studies major from Dartmouth College, she was a New York City Teaching Fellow and, in addition to several years in the classroom, she has worked in the public library system as a teen librarian. She is the Associate Librarian at Scholastic Inc. and has worked as an adjunct reference and special projects librarian at CUNY Brooklyn College. A regular contributor to Scholastic’s On Our Minds blog, she can also be found on Goodreads or Twitter @dataquilter.