Tagged digital humanities

Runaway Quilt Project: Digital Humanities Exploration of Quilting During the Era of Slavery

PDF

Deimosa Webber-Bey, Pratt Institute School of Information and Library Science

Abstract

The Runaway Quilt Project began with methods and management exercises for a course during library school, archived on a research blog. The initial goal was to use digital humanities tools to explore the plethora of data that exists regarding quilting during the era of slavery, looking for interesting trends and correlations. The “Maker Unknown” quilt preserves the results of research performed during this course. The following year, this endeavor continued with other library school projects, and the goal evolved from simply exploring quilt data to creating a meaningful interpretation and presentation of the information aggregated. The “Maker Known” quilt preserves the data visualizations created during the second year of research.

Introduction

The development of the World Wide Web has had a profound impact on quilting at the turn of this century, as the development of the printing press impacted it at the turn of the last. Before the printing press was invented, quilt patterns were passed from quilter to quilter; after it was invented, quilt patterns were mass distributed in magazines and newsletters. Before the invention of the World Wide Web, quilt research was primarily qualitative, relying on the analysis of surviving pieces in museum collections; since the web’s development, it has become possible to study large swaths of surviving quilts held in museums, as well as those personally owned and itemized in various documentation projects. This presents quilt scholars with a wide range of new opportunities.

My grandmother is both a quilter and a teacher, traits which she has passed down to me. She meets weekly with an informal quilting circle, passing on knowledge and patterns to her peers. We are both members of the Empire Quilter’s Guild, where quilters in the metropolitan area meet monthly for professional development and inspiration. My favorite part of the monthly meeting is a show-and-tell, where twenty to thirty quilts are displayed in rapid succession. Members share recently completed quilts as well as works in progress. These objects of art vary from traditional block patterns in muted tones to innovative uses of color captured in modern abstract designs. Each quilt shown is documented by the guild, and the online gallery of photographs from each meeting expands the audience from those present in the room to anyone with an internet connection. When the meeting is over and this group (of predominantly senior citizens) leaves the meeting, folks on the sidewalk that see these women emerging from the building with tote bags and rolling suitcases have no idea that they are crossing paths with fine artists. The meeting is inspirational.

In my second semester at the Pratt Institute School of Information and Library Science, during an introductory Digital Humanities course, our professor, Dr. Chris Alen Sula, advised that we explore the same topic throughout the semester as we learned various digital tools for scholarship. This lab course taught us how to support twenty-first century scholarship in the humanities as librarians, and since it was my opportunity to engage any topic I desired, I decided to study African American quilting in the nineteenth century and use a blog, which I named the Runaway Quilt Project, to enable public interaction and feedback. This project eclipsed the one semester and eventually took center stage during my time at Pratt, and this article reflects two years of experimentation with digital humanities tools.

Trained as both an African and African American Studies scholar and a quilter, I am intrigued by the myth that quilts were used as signs on the Underground Railroad, and I am more than aware of the controversy that surrounds it. In fact, I avoid taking sides; as an African American female quilter I want to believe that women in slavery and their quilting peers on the outside were capable of such acts of resistance, but as an academic I know that there is no smoking gun/quilt and that the case against this legend has been well established. However, I chose to create digital objects that tell the story of quilting during the era of slavery so that I understand the context of this debate, and the resulting materials neither support nor refute the myth. These digital objects serve as a foundation for exploring trends in the data and developing research questions.

The tools and experimentation process take central stage in this narrative because the main purpose of each exercise was to learn how to create a digital object for a class assignment. Sometimes a later assignment allowed me to explore an idea or discovery in more depth, and at other times the research pursued a tangent or jumped into something new. At the end of each year, following discussions surrounding the preservation challenges of digital research projects, I created a tactile object – a quilt – that captured information and visualizations that could be represented on a two-dimensional surface. This allowed me to archive my research and share it with a non-academic audience, such as during the show-and-tell at the Empire Quilt Guild meeting. Ultimately, I entered these archival quilts into the International Quilt Festival to share my experience and use these objects of interest to drive traffic to the research blog that contains two years of work. This provides me with a critical mass of views so that I can eventually evaluate the blog and research process using altmetrics.

Altogether, this article privileges process over product. At the beginning, I examine the background for this research, including Brackman numbers, digitization projects, and the myth of a quilt code. This leads into textual analysis and introduces Gracie Mitchell, a quilter and ex-slave interviewed by the WPA Federal Writers Project in 1938. I present the experiments that were inspired by Mitchell’s interview transcript individually, with a brief discussion of the digital object at end of each section; they are not analyzed in full because my intention is to show rather than tell. At the end of this paper, I discuss documentation, preservation, and sharing, and I introduce the revised data quilt that preserves my work.

Background

In his seminal essay, “English and the African Writer,” Chinua Achebe discusses the use of English for communication:

The African writer should aim to use English in a way that brings out his message best without altering the language so much that its value as a medium of international exchange will be lost. He should aim at fashioning an English that is at once universal and able to carry his peculiar experience. I have in mind here the writer who has something new, something different, to say. (Achebe 1997, 347)

In the twenty-first century I interpret this charge to now include the use of HTML, the medium of international exchange on the World Wide Web, and so I attempt to use the tools of Digital Humanities to say something new and different about my particular experience as an African American quilter. The simple informational displays created for this project constitute practice for me, preparing me for future in-depth research.

Data visualization and the African & African American studies scholar

The week that we learned to use Tableau Public, a free data visualization tool, I created a digital object that has nothing to do with quilting, but everything to do with my interest in resistance during slavery. I turned to the Voyages Trans-Atlantic Slave Trade Database, where there are 34,946 records in the “List of [slave] voyages” from 1514 to 1866. The website enables users to create visualizations, but users can also create and download custom tables, so I downloaded a table with only the data for voyages where the slaves resisted their captors. I experimented with several different chart configurations before I settled on a bubble map:

Figure 1: Bubble map for resistance during Middle Passage

Figure 1. Bubble map for resistance during Middle Passage

Left to right shows the continuum of days during middle passage, the size of the circle markers show how many slaves were on a ship, and the color indicates what country the slaves are from. Interesting questions that emerge from the data visualization include:

  • Why did slaves from Senegambia (pale green) who resisted tend to rebel on the first third of the voyage?
  • Why did slaves from Bight of Benin (dark orange) who resisted tend to rebel during the second half of the voyage?
  • Why did slaves from Sierra Leone (purple) and the Windward Coast (lavender) who resisted tend to rebel about fifty days into Middle Passage?

Creating this visualization gave me good practice with Tableau Public, and this example demonstrates the potential for using data visualizations to develop research questions.

Quilt digitization and documentation projects

The exciting part of exploring this subject in the digital humanities realm is that, with the affordances of the Internet and quilt documentation projects, particularly the Quilt Index, I was able to sit at my desk and download data for thousands of quilts. Before, conducting this work might have required a lifetime of traveling to museums and private homes to collect information. Since museums and research collections have posted their collections online and hosted documentation days, where private quilt owners bring in quilts to be photographed, dated, and sometimes placed geographically, the Quilt Index has been able to collect these virtual collections in one place on the web. This allowed me to build on their work and to create data visualizations and interactive digital objects that I and the public can explore, looking not for answers, but for interesting trends that led to new research questions and serendipitous discovery.

Brackman numbers

Many of the quilts in the Quilt Index and other archival collections are tagged with a Brackman number, from Barbara Brackman’s Encyclopedia of Pieced Quilting Patterns, which provides authority control for cataloging. This encyclopedia standardized the classification of quilts in 1993. Previously, patterns might be described in many different ways, but Brackman (1993) divides patterns into 25 categories, “classified and grouped into categories on the basis of the basic unit of design and the way it is repeated (its repeat). These visual categories are usually defined by seam lines that organize designs into types” (13). According to Janice Price (2011), Collection Manager at the International Quilt Study Center and Museum and a graduate of University of Nebraska-Lincoln’s unique quilt emphasis program, Brackman numbers are universal identifiers understood in the entire quilting domain. Brackman’s The Encyclopedia of Pieced Quilting Patterns and The Encyclopedia of Applique are considered the essential guides, with the potential to make databases interoperable. When quilt archivists are cataloging a quilt with no know title, location, or quiltmaker, eliminating the question of author or title entry, they begin by dating it within a twenty-year range. To do this curators identify patterns using the 1” x 1” pictures in Brackman’s encyclopedia.   They then examine the fabric and its colors, as well as whether the item was machine-stitched. Price acknowledges that dates change frequently as quilt historians make new discoveries. The quilt revival has been able to cope with the explosion of quilt documentation due to the affordances made possible by Brackman’s meticulous work.

The myth of a quilt code

One subject that has occupied popular conversation in the quilt domain since the 1996 publishing of Hidden in Plain View is the theory that quilt blocks were used for a code system in the Underground Railroad (Tobin 1999). Jacqueline Tobin advances the idea that different block patterns had unique meanings and that when the quilts were hung outside on clotheslines, fences, and porch railings, runaway slaves potentially interpreted the coded messages and acted accordingly. This controversial theory has two camps: one which asserts that there is no proof, and one which believes that this act of resistance is obvious, particularly due to the lack of proof, because success required discretion. It therefore occupies what Mary Louise Pratt refers to as a “contact zone,” the space between oral history and the written record, where these two distinct camps meet, clash, and grapple with each other (Sharpe 2003, 4). An example of this is the March 2003 Traditional Quiltworks article, “Betsy Ross redux: the Underground Railroad ‘Quilt Code,’” expanded into an e-book on the author’s website, where Leigh Fellner (2006) meticulously refutes the details included in Hidden in Plain View and devotes space to a “Hall of Shame” for “A seemingly endless cavalcade of retailers (almost exclusively white) who use slavery, African-Americans, and the ‘Underground Railroad Quilt Code’ as a marketing tool.” However, in this current global culture, picture books such as Sweet Clara and the Freedom Quilt, in which a slave creates a map quilt with the Underground Railroad route stitched onto its surface, and the proliferation of quilt code lesson plans on the Internet, ensure that this idea will persist into subsequent generations and feed popular consumption (Sharpe 2003, 40).

Jenny Sharpe (2003), in Ghosts of Slavery, argues that in the absence of written information historians are forced to turn to oral histories to examine conjecture and understand what may have happened, so it is important to note that the data that I use for this project is incomplete (25). The quilts that have survived and inform this research represent a fraction of the quilts and quilters that were active in the era that I am studying. The experiments that I conducted with this data are as significant for what they do not say as they are for what they do. Like Sharpe, I am using an incomplete dataset to better understand a subject we cannot definitively know, since both the quilts and the narratives of slaves cited in this study represent the fraction that have survived the passage of time. Sharpe (2003) writes:

Rather than equating a black female subjectivity with individual consciousness or modes of self-expression like songs and testimonies, I locate it between written and oral histories, first-person and third-person accounts, pro- and antislavery writings, and at the point where the unspoken narratives of everyday life intersect with the known stories of slavery. In noting the inadequacy of language, I also denote the limits of this study as an effort to describe the everyday lives of female slaves, about which we have much to learn but can never fully know (xxvi).

I have been aware of the controversy regarding whether or not quilts were used as signposts on the Underground Railroad for years, so rather than ascribe to the arguments of either side, I used this opportunity in library school, learning tools for twenty-first century scholarship, to research quilting during and directly after the era of slavery within the general American and specifically African American population. Recognizing my limits, as Sharpe does, my goal was to create objects that stimulate conversation so that I can learn from scholars and quilters alike, facilitating serendipitous discovery and recording the cultural knowledge possessed by my grandmother and her quilting peers.

In Ghostly Matters, Avery Gordon (2008) writes about the need to investigate “that which makes its mark by being there and not there at the same time,” and the goal of the Runaway Quilt Project is not to prove or disprove a legend passed down through oral tradition (6). My objective is to understand the context of this legend while contributing empirical information to the field of African American and quilt scholarship that facilitates quantitative analysis for a variety of academic inquiries. At a minimum, quilting allowed African American women a form of artistic expression during a time of subjugation and dehumanization, and as Saidiya Hartman cautions, we should not “overestimate the subversiveness of everyday acts of resistance in the face of terror and cruelty suffered by slaves and the constraints placed on their agency” (quoted in Sharpe 2003, xv). However, the overwhelming appeal of the idea of a quilt code to the human psyche creates not only a hook or point of interest for this research exercise; it also offers an opportunity for future investigation into how slave myths and legends formed, as well as how they inform African American culture today. As Gordon (2008) writes:

[A]ny people who are not graciously permitted to amend the past, or control the often barely visible structuring forces of everyday life, or who do not even secure the moderate gains from routine amnesia, that state of temporary memory loss that feels permanent and that we all need in order to get through the days, is bound to develop a sophisticated consciousness of ghostly haunts and is bound to call for an “official inquiry” into them (151).

African American quilters have not been allowed to enshrine this everyday act of resistance into the historical record because of its foundation in oral tradition, a lack of concrete evidence, and details that may have become exaggerated over the passage of time. Yet, the persistence of this legend required me to address it, since it has become enshrined in the narrative of popular culture, and my opinion on this controversy is, and will continue to be, a question frequently asked by family, friends, peers, and colleagues. My answer has to be informed.

Oral history and digital annotation

For our first foray into digital humanities, we explored digital annotation, and I decided to take advantage of the Library of Congress’ online American Memory collection. During the 1930s, the Works Progress Administration conducted interviews with African Americans who were former slaves. Searching for the keyword “quilt,” out of over 2,300 interviews, which were digitized for Born in Slavery: Slave Narratives from the Federal Writers’ Project, 1936-1938, I found that 156 (6.78%) mention quilting (Library of Congress Manuscript Division 2001). Over the course of a week, I read each of these interview transcripts and themes began to emerge. As I transcribed, I divided the quotes into categories:

  • Quotes from (or about) specific female slaves who quilted
  • Quotes that explain how quilts were made
  • Quotes that describe how quilts were used
  • Quotes from anecdotal stories where quilts are mentioned
  • Quotes about a term that was new to me – the “quilting party”

To share this work in an interactive forum, I created a Digress.it website, where users can comment on each quote individually, engage the text, debate interpretations, and make their own meaning of the text. These brief mentions of specific patterns, methods, and hanging out at a “quilting” late into the night, show that the craft was economically, socially, and politically essential to the community. Unfortunately, Digress.it seems to no longer be a functional website, so I created pages on the blog that list the quotes by topic, but users will no longer be able to comment at the paragraph level. One transcript that caught my immediate attention was that of Gracie Mitchell, interviewed in Pine Bluff, Arkansas. Like an Empire Quilter, Mitchell conducted a show-and-tell with her captive audience, interviewer Bernice Bowden. In the notes for Mitchell’s interview, Bowden included a list of the twenty-two quilt designs that Mitchell showed her on that day (Mitchell 1938). This list, and Mitchell’s transcript, became central to my research experience, influencing the direction of further inquiry.

English literature and line graphs

The Google Ngrams tool measures how often phrases occur in books scanned as part of the Google Books project, and so I looked at terms related to large gatherings of slaves, such as “cornhuskings,” “log rollings,” and “quilting parties,” as well as quilt block names. These were analyzed in relation to relevant time periods and terms, such as “runaway slave” and “underground railroad,” and presented as graphs with observations.

To begin with, quiltings, candy pullings, log rollings, and corn shuckings were significant social gatherings identified by ex-slaves interviewed for the Federal Writers’ Project in the 1930s. Explaining “quiltins,” three interviewees state that, with permission from their masters, slaves were able to attend a quilting at another plantation, which presented a significant opportunity for socializing and the communication of ideas (Avery 1936, 3; Davis 1938, 9; Mullen 1936, 3). Regardless of whether they were intentionally subversive gatherings, the presence of alcohol and limited oversight is significant. The “quilting party” also figures significantly in 19th century American texts, as shown in Figure 2 below.

Figure 2: English quilt term variants 1800-1900 (sm=5)

Figure 2. English quilt term variants 1800-1900 (sm=5)

This chart shows that the most popular way to refer to the event being discussed was “a quilting,” followed by the plural version “quiltings.” Both of these use the string of letters q-u-i-l-t-i-n-g as a noun, and its use as a noun is far more popular than its use as an adjective to modify “bee” or “party.” Investigating the sources scanned in Google Books that make up this data confirms that in the phrases “a quiltin” and “a quilting,” q-u-i-l-t-i-n-g is being used as noun, not a verb or adjective. A quilting was its own significant categorical event in the American psyche. All of the terms occur less frequently in British English publications, and both “quilting party” and the informal variant “a quiltin” are absent altogether, as shown in Figure 3 below.

Figure 3: 19th century British English quilt gathering term variants (sm=5)

Figure 3. 19th century British English quilt gathering term variants (sm=5)

This chart indicates that audiences for “quilting parties” and “quiltins” are unique to the American population. The “quilting party” is mentioned more in nineteenth-century American print publications than any of the terms in British print. Returning to Figure 1, it shows that these American phenomena were first mentioned in print in 1820.

  • The phrase “quiltin” peaks in American print in the 1840s (~0.000000850%) and “quilting party” in the 1850s (~0.000001750%).
  • The phrase “quiltings,” the most frequently occurring variant in British print, was most popular in the 1830s (~0.000001600%).

Filtering out British publications, I analyzed the terms to examine the American experience (Figure 4).

Figure 4: American English quilt gathering term variants (sm=3)

Figure 4. American English quilt gathering term variants (sm=3)

  • Most of these variants show a rapid increase in American print usage of the terms between 1820-1850.
  • The phrases “quiltin,” “quiltings,” and “quilting party” slowly decrease in occurrence in American print throughout the twentieth century.
  • The “quilting bee” replaces “quiltin,” “quiltings,” and “quilting party.”

The phrase “a quilting” sees revival and growth beginning in the 1970s, but investigating the Google Books used for the data set shows that, for the latter half of the twentieth century, quilting is used as an adjective in these occurrences, not as a noun. Falling out of usage first is “a quiltin,” hitting a low during the 1920s and never recovering. The phrase “quilting party” occurs about as often in the 1940s as it does in the 1850s, holding consistent for roughly one hundred years before a steep decline in the 1950s. The pluralized noun “quiltings” decreases in popularity beginning in the 1880s and continues to decrease throughout the twentieth century. Social quilting gatherings by these names have a life span of about 140 years, likely their audience did as well – meaning that the quilters who used this specific term were a distinct group of women born in the mid- to late-nineteenth century, who died in the early to mid-twentieth century without passing on the specific habits related to this term to the next generation of quilters. In the span of one generation, these particular nineteenth century American quilters, a phenomenon occurred that did not exist before, and it has since faded from collective discussion. If they didn’t pass down the term or practice of “quiltings” to their daughters, then we can infer that there is related information that was also lost.

Searching for quilt needles in a haystack

While the correlation between English literature and African American quilters is slim, curiosity required that I look for the frequency of use for phrases that are associated with the Underground Railroad quilt code legend. Figure 5 shows the introduction of related phrases into American English texts.

Figure 5: American English URR Myth (sm=1)

Figure 5. American English URR Myth (sm=1)

  • The uniquely American social gatherings to finish quilts predate the popular phrase “Underground Railroad,” but not the act of resistance embodied in the phrase “runaway slave.”
  • The two Google Books showing “Underground Railroad” mentioned in 1800 are incorrectly dated and are actually from 1860 and 1890.

As Figure 6 indicates, of any social gatherings for slaves with the potential for planning such an endeavor, a “quiltin” or “quilting party” are the most significant.

Figure 6: Terms for slave gatherings in American English during the URR (sm=0).

Figure 6. Terms for slave gatherings in American English during the URR (sm=0).

Looking at the events surrounding significant bumps on this chart:

  • The Fugitive Slave Act of 1850 requires that runaway slaves be returned to their owners.
  • In 1854 the Republican Party forms.
  • In 1857 the Dred Scott decision states that the Bill of Rights does not apply to slaves.
  • In 1858 Abraham Lincoln, nominated by the newly formed Republican Party, runs for Senate.
  • In 1860 Abraham Lincoln is elected President of the United States.
  • January 1, 1863, President Lincoln signs the Emancipation Proclamation.

After looking at significant terms for slave gatherings, I examined phrases used to describe quilt gatherings, the act of resistance, and pieced quilt block patterns that were included in Bowden’s interview notes for Gracie Mitchell. Of particular note, in the WPA slave narrative interview with Walter Rimm, he describes a quilting party where a runaway slave escapes a trap set for him by patrollers, yelling “Bird in de air!” into the night as makes his getaway (Rimm 1936-1938, 2). This is of particular note because the “bird in the air” or “birds in the air” pattern is one of the quilt block patterns most frequently associated with the Underground Railroad quilt code myth. It is theorized that this pattern (aligned triangles) was hung on a railing, porch, or clothesline, with the triangles aiming North, South, East or West, so that escaped slaves could determine which direction to go. It does not prove anything, but the fact that a slave yells this particular phrase while running away from a quilting party is both interesting and significant.

Figure 7: URR terms and quilt patterns in American English (sm=1)

Figure 7. URR terms and quilt patterns in American English (sm=1)

The theory of a quilt code has many enthusiasts, but no concrete evidence. Quilt historians and Underground Railroad scholars have disputed and criticized the idea since it came to light.  An examination of the relative occurrence of all social slave events and acts of escape shows that quilt gatherings had the most potential for the correlation of activities, and looking at the quilt patterns associated with the myth demonstrates that the phrases “railroad crossing,” “breakfast dish,” “birds in the air,” and “half an orange,” are significantly used in the decade prior to Emancipation. However, figure 7 does not offer any compelling circumstantial evidence that would support or refute claims that these patterns were used for a quilt code.

Gracie Mitchell: Snapshot of an African American Quilter

I created a timeline for Gracie Mitchell, using Timeline JS, in order to present an interactive object that gives context for the era during which she lived. In addition to dates from her life that she described during the interview, I researched the significant dates for the quilt patterns that she showed her interviewer in 1938. Copying the template provided by the Timeline JS site, I created a Google Sheet with time-series data related to details from Gracie Mitchell’s interview transcript, where the Bernice Bowden included two pages of notes. While one notes page lists all of the quilts that Mitchell showed Bowden that day, another page lists details such as the exact duration of Mitchell’s residence in each state and the years that she moved. Following that, I researched relevant historical items (including still images, audio, and video) for each time span, topic mentioned, or location lived in, and placed it in the appropriate place chronologically. I set the timeline to begin with the date she was interviewed, so that to read it the user has to go backwards in time from 1938. This software is easy to use and produces digital objects that are simple to navigate.

Figure 8: Timeline for Gracie Mitchell

Figure 8. Timeline for Gracie Mitchell

Geospatial mapping – part one

For our first foray into mapping I used the Leaflet Maps Marker tool (a WordPress plug-in) to create interactive maps of 19th century quilt pattern occurrences, relying on data from the online collection of the International Quilt Study Center and Museum. Gracie Mitchell’s interview transcript provided me with a thematic grouping of quilt patterns to work with, and each map uses one of Leaflet Maps Marker’s symbols to represent a quilt pattern. The symbols are placed where the quilt was made. Clicking on the symbol provides a pop-up window with metadata for the particular quilt, and the aggregated map, shown in figure 9, depicts all of the maps layered together.

Figure 9: Aggregate map of 5 Gracie Mitchell designs

Figure 9. Aggregate map of 5 Gracie Mitchell designs

One constraint of this activity at the time that I worked on it was that only five of Gracie Mitchell’s quilt patterns were mapped. Of those that were mapped, most of the occurrences are concentrated in the Northeastern United States.

  • Broken Dishes: The earliest example of this design is from New England, circa 1860-1880.
  • Sawtooth: This is the second pattern design listed in the 1938 interview record. There is one early quilt (circa 1830-1850) that was produced in Alabama. However, most of the pattern occurrences (including the earliest, circa 1820-1840) are in modern day Pennsylvania; 19th-century quilters were likely inspired by the rugged terrain of the Appalachian Mountains.
  • Tulip Appliqué: Gracie Mitchell referred to appliqué as “laid work.” This design made it to Indiana by 1860.
  • Cactus: Because Gracie Mitchell called the design she completed “Prickle Pear,” it is possible that she appliquéd the design. However, the interviewer did not list “appliqué” or “laid work” as she did for other pieces that used that method.
  • Birds in the Air: This pattern is has a strong affiliation with the quilt code myth, and the phrase is used significantly in an ex-slave’s interview, as noted earlier. Ms. Bowden lists it as “Birds All Over the Elements” in the interview transcript.

This mapping exercise was both intriguing and frustrating, as it had incredible potential for analysis, but I was not working with the ideal tool. One year later I would return to this problem.

Network analysis

For my final Digital Humanities class project in the spring of 2012, I decided to preserve the data I curated during the project (Jan-May 2012) on a quilt top. Using Cytoscape, open source software for visualizing networks, I created a frequency map of the quilt block patterns that were mentioned by Gracie Mitchell in 1938 and also existed in the 19th century. The size of the block shows how often the quilt pattern occurs in the IQSCM collection. The colors of the log cabin block, the largest square (one side of the quilt), represent the five types of quilts. The quilt is framed with a border that provides the source code for the home page of the project website in May 2012, and the hanging loops around the edges represent the ethnicities of the women working together on an object at a quilting party. The network of quilt blocks is constructed by hand and by machine, using multicolored thread.

Figure 10. Planning notes, quilt front (log cabin block with quotes), and quilt back (remaining blocks)

To finish the quilt, I held a quilting party with some of my female friends, and after presenting in the quilt in class and at the Pratt SILS Student Showcase, I entered it in the show-and-tell at the Empire Quilters’ meeting in May 2012.

Documentation

I created a video to capture the process of creating this quilt, titled Maker Unknown because 81% (141 out of 175) of the nineteenth-century quilts used for research in this project were listed in the IQSCM catalog as “Maker Unknown.” The quilt is dedicated to the slave women who labored as quilters, creating art for everyday use, and to all post-Emancipation quilters and quilt enthusiasts who keep their legacy alive.

  • The quilt was constructed in April and May 2012 in New York City (Brooklyn and Queens).
  • The quilt blocks were pieced by Deimosa Webber-Bey (Log Cabin, Tulip Appliqué, Orange Peel, Reel, Railroad Crossing, Tree of Life, Sunflower, Birds in the Air, Bird’s Nest, Ocean Wave, Drunkard’s Path, Leaf) and her grandmother, Marian Webber (Feathered Star, Carolina Lily, Sawtooth Star, Broken Dishes, Cactus, Whirligig).
  • The Log Cabin block was made by printing the data and images aggregated during the project, as well as the QR and source code for runawayquiltproject.org, onto fabric treated with Bubble Jet Set.
  • Quilting around the data strips on the Log Cabin block was done by hand in variegated thread by Tiana Grimes, Erica Schwartz, and Deimosa Webber-Bey at a quilting party, in keeping with nineteenth-century construction techniques; the hanging loops represent enslaved nineteenth-century quilters sitting around a quilt, and they are made from African (15/16) and Native American (1/16) fabric (in 9 out of 156 interviews used for this project, the ex-slave identified Native American heritage).
  • The information on the Log Cabin block faces out from the center in all directions so that it is best engaged when placed on a table, with observers seated around it making their own meaning of the information presented.
  • There is a suggested citation on the quilt top.

Ego network

During the spring of 2013, I took Dr. Sula’s Information Visualization course, and I returned to the problem of network analysis. For this visualization experiment I retrieved a dataset from the Quilt Index by searching for quilts made in the different geographic locations where Gracie Mitchell lived when she lived there. Her interviewer, Bernice Bowden, recorded the places where Mitchell lived during her life and the years that she lived in each. The result is a sample dataset of quilters, her contemporaries, and the patterns that were being made around her, by her contemporaries, throughout her life. While Gracie Mitchell’s quilts may not have physically survived, their occurrence – or instantiation – was documented by an authority, so the goal of this ego-centric network was to create a digital object that shows the context in which Gracie Mitchell quilted and chose the twenty-two patterns that she executed.

First, using Cytoscape, I uploaded the column with locations as the source, the quilter column as the interaction, the pattern column as the target, and the year column as an edge attribute. Then, in the Custom Graphics Manager pane I added a Sawtooth Star icon to the list. I changed all of the nodes to Sawtooth Stars, except for the locations, for which I found public domain state icons, and I changed the font to Courier, which resembles the typeface used in the WPA narratives. Then I selected the degree-sorted circle layout, so that Cytoscape would run a calculation that would allow me to use degree as a node attribute.

Next I chose to use the date attribute for continuous mapping of the edge color. This allowed me to create a gradient that identifies the period when the quilt was made; I chose to leave the edges black for quilts made during the era of slavery. Then I changed the node sizes so the degree of magnitude is 10x their in-degree number and the location node sizes are 10x the number of years that Gracie Mitchell lived in each place. I also changed the edge line style for Gracie Mitchell to dashed lines and the edge line style for all of the other quilters to dotted lines. At this point I made minute manual adjustments to the positions of a few nodes in order to minimize the overlap from the node labels. I shared my network with a few friends to get a sense of readability and what story it was telling, and I got a suggestion to position the locations relative to each other as they are geographically.

Figure 11: Edge weighted force directed layout

Figure 11. Edge weighted force directed layout

I was concerned that the network gives the impression that all of Gracie Mitchell’s quilts were made in 1938, so after manipulating the nodes awhile, I settled on placing the geographic place names in the center, Gracie’s quilts in an inner circle (degree sorted), and the quilts made around her in an outer circle (sorted alphabetically). This places Gracie in the center of the network and shows how the quilt patterns she chose fit into the larger context of where she was living and how she was influenced by the quilters around her. The network visualization depicts the patterns created in the states where Gracie Mitchell lived while she was there. The lines represent each quilter that executed the pattern and the line colors indicate the year the quilt was made.

Figure 12: Ego centric quilt network

Figure 12. Ego centric quilt network

With a growing sense of my final project for Information Visualization looking like a Reconstruction era American flag, I created an ego network with a circular layout, placing the Quilt Index data on the outer ring, Gracie Mitchell’s twenty-two designs in an inner ring, and the three residences in the center. The visualization infers the following:

  • Gracie Mitchell probably became familiar with certain patterns, such as the Feathered Star, Sawtooth Star, Log Cabin, and Sunflower, while living in Texas, where she resided until she was almost 40.
  • She possibly learned how to do the Tree of Life pattern while she was living in Chicago for eight years.
  • Only the Orange Peel overlaps with work that has survived from Arkansas.

In comparison with other quilters of her location and era, you can infer that her pattern selection was influenced by her experiences in other states. But the fact that very few of her designs overlap with contemporaries’ shows that she was experimental, and perhaps one of the first in her area to purchase a book of patterns. She does state that she had a book of patterns in her interview, lent to a friend and never returned (Mitchell 1938, 2).

Big Data and Its Affordances

At the beginning of the 2013 spring semester, I decided to use a more comprehensive database, the Quilt Index, to continue the project. The Quilt Index is somewhat comparable to WorldCat, in that it is a compilation of records from many different quilt collections. It is a free, open-access project of Matrix,  Michigan State University Museum, and the Quilt Alliance. There is less consistent metadata, but the pattern name and year are almost always present, which is essential to the interactive map problem that I was working on. Using the search tool, I was able to construct large comparison tables for item records, and then copy and paste them into Excel. After bringing the file into Google Refine, a software program for cleaning messy data, I was able to enforce a controlled vocabulary for the quilt pattern names in about 750 item records and format all of the dates similarly.

Using Google Refine, I clustered/merged the patterns and quilter names and then clustered/merged the dates as text facets in order to delete the “c” for circa in front of some dates and turn date ranges like “1860-1890” into the earliest potential occurrence (“1860”). After that I transformed the column into dates. After some additional cleaning, I was able to make several linked datasets available openly through Google Sheets.

Geospatial mapping – part two

Now that I had a significant dataset, occurrences of the twenty-two patterns Gracie Mitchell used during the years 1800-1849, I transferred it to a Google Fusion Table. With this brand new tool, I was able to view the quilt pattern occurrences on a full screen map and share a link where others could zoom in and out, and they would finally be able to filter by pattern! This was an improvement over the WordPress plug-in that I used during spring 2012, which only allowed me to add markers one at a time (and I never finished building the layers for all twenty-two patterns). The map shows all of the patterns with a different icon, and the user can zoom in and filter. Regarding icons, I chose images that somewhat related to the name of the pattern (for example, “drunkard’s path” is represented with a martini glass), but the best imagery for this map would be the actual quilt blocks. As this map is very cluttered, I knew that in the end I would be making small multiples in order to facilitate analysis of the data.

Geospatial mapping – part three

Returning to my mapping challenge once again, I used Tableau Public to create an individual map for each block pattern. Initially, I had a complex spreadsheet and cluttered maps, but I decided to only show the oldest instances of the quilt pattern documented in the quilt index (roughly ten or fewer data points) so that users can consider the possible geographical origin for each design. They can also compare the designs to each other, getting a sense of what patterns are the oldest in the dataset.

After uploading my dataset with 171 records into Tableau, I had to clean it. If the location for where a quilt was made was not clear in the full item record (in the “location,” “provenance,” “quilt history,” or “quiltmaker address” fields), then I entered a location based on the address of the owner (usually a relative/descendant of the quiltmaker), the person who brought the quilt in for donation or documentation. There were about a dozen instances where I entered the location of the contributor (to the Quilt Index) or the quilt collection. Next, I uploaded the file into Tableau and created a map visualization using the pattern field, which gave me horizontal maps. I used the pattern field again to create columns, which gave me a grid with square maps. The ones that I needed were in a diagonal from the top left of the visualization to the bottom right, so, using Microsoft Paint, I cropped screen shots of each pattern map for small multiples:

webber-bey-paintb
webber-bey-paintc
webber-bey-paintd
webber-bey-painte
webber-bey-paintf
webber-bey-paintg
webber-bey-painth
webber-bey-painti
webber-bey-paintj
webber-bey-paintk
webber-bey-paintl
webber-bey-paintm
webber-bey-paintn
webber-bey-painto
webber-bey-paintp
webber-bey-paintq
webber-bey-paintr

Overall I was pleased with the way that the maps turned out. Some of them are dense, and in order to fit them in the same size square you lose readability (such as with the Log Cabin, Sunflower, Tulip, and Reel), but it is a worthy sacrifice for the overall effect. I was able to save my visualization to the web with Tableau, and embed the maps into my blog.

Heat map

In order to get a sense of the popularity of each of the twenty-two patterns over time, I retrieved a dataset from the Quilt Index that spanned 1840-1940 – the 100 years prior to Gracie Mitchell’s WPA interview. Using Google Refine, I made authoritative choices for pattern names and dates (changing circa spans to a specific year), and then, using Tableau, I created a heat map with the data presented in five year “buckets,” where color codes frequency in the matrix.

Documentation

At the end of the spring 2013 semester, I aggregated final versions of the information visualizations into a whole cloth design for a quilt, a second draft of the “Maker Unknown” quilt that I constructed the previous spring, and had the design printed onto fabric. This textile object and infographic is a more thoughtful execution of my research into Gracie Mitchell, and so it is named “Maker Known.” I decided to approach this infographic quilt with three questions:

  • How was Gracie Mitchell influenced by the quilt(er)s around her?
  • What is the geographical origin for each pattern?
  • How popular were each of these designs during the final decades of slavery in the U.S. and during Gracie Mitchell’s lifetime?

Figure 13: Data quilt 2.0 - "Maker Known"

Figure 13. Data quilt 2.0 – “Maker Known”

The overall data quilt is designed to resemble a Reconstruction-era flag, and the colors used are hues of red, white, and blue, where red is consistently used to emphasize significant data and the background white is a word cloud generated with Wordle from the RQP digital annotation exercise. The heat map runs across the bottom of the data quilt top, adding to the flag impression with more horizontal stripes. The heat map shows the frequency with which twenty-one of the twenty-two patterns were made; the log cabin pattern occurs the most frequently, making up almost half of the items retrieved for the data set, so it is highlighted with its own chart, separated from the heat map because it is an outlier and heavily skews the visualization when included. In the heat map a vibrant red codes high frequency and dark blue codes low frequency. In the chart for the log cabin, like the small multiple maps, red codes an item as older, blue as newer, and size codes frequency.

Overall this infographic quilt represents using data to place the historical figure Gracie Mitchell in context. The visualizations show that she was experimental and executed several quilt designs that were established patterns, but not frequently made by her contemporaries. She also created a few quilt tops that demonstrate her familiarity with traditional patterns that existed during the era of slavery and continued to be popular throughout her lifetime. I quilted the final tactile object at home, by machine, and then submitted this quilt and “Maker Unknown” to the International Quilt Festival.

Conclusion

Ultimately, “Maker Known” was accepted into the International Quilt Festival, and the quilt traveled from August 2013 to August 2014. In the fall of 2013, I traveled with my sister and grandmother to the show in Houston, Texas, where I saw my quilt hanging in one of the most highly esteemed quilt shows in the field. While I still feel that I am an amateur quilter, I know that the piece earned its place because of the eighteen months of research and design that went into it. It was important as well, as a personal accomplishment, to share the experience of traveling to Houston to see my work in the show with my grandmother in her eighty-fifth year. This is my proudest achievement to date.

Figure 14: "Maker Known" at the International Quilt Festival in Houston, TX

Figure 14. “Maker Known” at the International Quilt Festival in Houston, TX

Now that the quilt has been returned, it is my hope that traffic to the blog will continue and that readers will comment on and annotate the digital objects. These second, third, and fourth sets of eyes may identify ghosts that I could not see in the data. Ideally, this research will engage quilters as well as digital humanists and African American Studies scholars, whose knowledge of the craft can piece together the past and unleash the imaginative force of what might have been (Sharpe 2003, xii). These conversations will inform my future research.

Bibliography

Avery, Celestia, interview by Minnie B. Ross. 1936. Born in Slavery: A Few Facts of Slavery (November 30).   OCLC #47265597

Brackman, Barbara. 1993. Encyclopedia of Pieced Quilt Patterns. Paducah, KY: American Quilting Society.  OCLC #27812938

Davis, Minnie, interview by Sadie B. Hornsby. 1938. Plantation Life as Viewed by an Ex-slave. OCLC #47265597

Fellner, Leigh. 2006. “Betsy Ross redux: the Underground Railroad “Quilt Code.” Hart Cottage Quilts. http://ugrrquilt.hartcottagequilts.com/ (accessed September 20, 2014).

Gordon, Avery. 2008. Ghostly Matters: Haunting and the Sociological Imagination. Minneapolis: University of Minnesota Press. OCLC #232663637

Library of Congress Manuscript Division. 2001. Born in Slavery: Slave Narratives from the Federal Writers’ Project, 1936-1938. Washington DC, 2001. OCLC #47265597

Mitchell, Gracie, interview by Bernice Bowden. 1938. Born in Slavery: Arkansas Narratives, Volume II, Part 5 (November 1).  OCLC #47265597

Mullen, Mack, interview by J.M. Johnson. 1936. Born in Slavery: Mack Mullen (September 8). OCLC #47265597

Price, Janet, interview by Deimosa Webber-Bey. 2011. Collection Manager, International Quilt Study Center & Museum (November 1).

Rimm, Walter, interview by WPA. 1936-1938. Born in Slavery: Ex-slave stories (Texas).  OCLC #47265597

Sharpe, Jenny. 2003. Ghosts of Slavery: A Literary Archaeology of Black Women’s Lives. Minneapolis: University of Minnesota Press. OCLC #50479199


About the Author

Deimosa Webber-Bey, MSEd MSLIS, is a librarian and educator with a passion for young adult literature, graphic novels, postcolonial subjects, and quilting. An undergraduate English and African & African American studies major from Dartmouth College, she was a New York City Teaching Fellow and, in addition to several years in the classroom, she has worked in the public library system as a teen librarian. She is the Associate Librarian at Scholastic Inc. and has worked as an adjunct reference and special projects librarian at CUNY Brooklyn College. A regular contributor to Scholastic’s On Our Minds blog, she can also be found on Goodreads or Twitter @dataquilter.

BeardStair: A Student-Run Digital Humanities Project History, Fall 2011 to May 16, 2013

David T. Coad, University of California, Davis
Kelly Curtis, San Jose State University
Jonathan Cook, San Jose State University
Dr. Katherine D. Harris, San Jose State University, Faculty Advisor

with Valerie Cruz, Dylan Grozdanich, Randy Holaday, Amanda Kolstad, Alexander James Papoulias, Ilyssa Russ, Genevieve Sanvictores, Erik White


 beardstair1

Figure 1. Header from first BeardStair Website

Abstract

In the current landscape of Digital Humanities and digital pedagogy, it is rare to see Master’s-level graduate students fully engaged in the process of building Digital Humanities projects, especially at large, underfunded public universities. The BeardStair Project is one such effort, housed at San Jose State University (SJSU). This article, conceived and written by graduate students on the BeardStair team, provides a detailed, reflective history of that work. It started when five rare Modernist books were left, anonymously, in San Jose State University’s library drop box, and were discovered by one of the four SJSU students who became the original BeardStair team. Working independently in a process of scholarly inquiry, with guidance from SJSU’s Digital Humanities scholar Dr. Katherine Harris, they began working on what they called the BeardStair Project—named for two of the books’ artists, Aubrey Beardsley and Alastair. Several semesters later, a spring 2013 course in modern approaches to literature, composed of eleven graduate students, set a research agenda of producing a scholarly digital edition of these rare books. This scholarly digital edition would be focused by the claim that “these books act as autonomous literary and artistic objects that can be valued for their merits outside, and in spite of, their original purpose as salable commodities.” The BeardStair Project is an ongoing experiment in the Digital Humanities, yielding unique implications for administrators, faculty, and students who are interested in building Digital Humanities projects and fostering collaborative digital pedagogies.

Introduction to the BeardStair History

Beginning in the fall of 2011 as a loose yet focused and fruitful student collaboration, and extending through the spring semester of 2013 (with an open door to future instantiations), the BeardStair Project is a unique and collaborative student-run Digital Humanities project at a large, under-funded state university. This is a history of what happened in that project (especially in its second instantiation), with the goals of illustrating the immense value of Digital Humanities work in English and Humanities Departments, as well as the persistent progress that can be made at any institution when the Digital Humanities are embraced.

The original BeardStair participants began the project in Fall 2011 when five old, mysterious illustrated books were left by an unknown party in a book-return bin at the San Jose State University campus library. Jesus Espinoza, a student who worked at the SJSU library at the time, brought the books to Dr. Katherine Harris, whom he knew from an undergraduate Digital Humanities course offered in a prior semester, a course that also discussed the history of the book. After doing some initial research on the discovered books, Dr. Harris discovered that two of the books, being rare editions with original artwork, were potentially valuable. She felt compelled to get students involved in making a digital edition of these valuable, cultural, literary, and historical resources. Of the artifacts that were most compelling there was a 1920 edition of Oscar Wilde’s poem, The Sphinx, a dramatic monologue ripe with Wilde’s wit and eloquence. There was also Sebastian van Storck, Walter Pater’s 1927 tale of a nihilistic Dutchman who achieves a tragic redemption by sacrificing himself to save a child, which was beautifully illustrated by Alastair. Finally, there was the Aubrey Beardsley’s 1919 edition of The Ballad of a Barber, a poem in ballad form that focuses on man’s aesthetic limitations.

Dr. Harris tweeted and emailed some former students who she thought might be interested in exploring and presenting research about the books. Four student participants, including Jesus, accepted and got involved in what became the original BeardStair project. They began by independently researching the books, their authors, artists, interpretations, and histories. The mix of undergraduates, graduate students, and former students met once a month to report on their research findings, ask new questions about the books, and set research goals for the next meeting. Dr. Harris served as a kind of project manager and advisor, but primarily, the students were in control of the research agenda and the act of researching. Eventually, the group accumulated enough intriguing information to present their findings at conferences and competitions (THATCamp Pedagogy, Re:Humanities Conference, and the CSU Student Research Competition).

However, because of a lack of funding and support from the university, these original BeardStair participants ran out of steam. In an effort to continue the project and award students with tangible success with regard to the project, Dr. Harris received approval to offer a graduate-level Digital Humanities course. The result was one of the most collaborative and exciting learning experiences many of these students had ever had the opportunity of being involved in.

A seminar in modern approaches to literature was added to the course schedule, giving university credit to eleven graduate students who reviewed the original BeardStair participants’ work, set tasks and goals for the semester, read scholarly editing theory, engaged in Digital Humanities debates, and moved the Project toward its inevitable goal: to produce a digital scholarly edition of the works. In order to accomplish that goal, BeardStair participants had to be able to communicate effectively, and, after considering multiple options, in the classroom and out of the classroom, BeardStair decided to use a social media website, Facebook.

Facebook afforded BeardStair participants some crucial advantages in developing the project. First, Facebook is free, and groups can be created that are accessible via invitation only. BeardStair participants used Facebook in exactly that way to great effect: creating a collaborative group; and circumventing faculty interference (after all, they felt it was truly their project) and other potential hijackers. Facebook, as a social media construct, proved invaluable to the development of BeardStair ideas; indeed, Facebook allowed for the free exchange of ideas in an area most of us were already very comfortable working in. Individuals that would not normally speak in a classroom setting posted to the group message board, ideas flowed more freely, and progress was made more efficiently. And, when the time came to decide what direction the BeardStair Project should travel, Facebook was a capable medium for genesis.

The BeardStair Project needed a foundation, a vantage point from which to engage the texts. Roland Barthes’s discussion of the plurality of texts in his essay, “From Work to Text,” was especially important in developing such a perspective. Barthes wrote that the text is “irreducible” and “accomplishes the very plural of meaning” and textual meaning is represented as “an explosion, a dissemination,” whereby the “plural of the Text depends…not on the ambiguity of its contents but on what might be called the stereographic plurality of its weave of signifiers” (Barthes 1978).  This analysis became the basis for Project BeardStair’s interpretive perspective, for BeardStair participants did not simply want to extract meaning from the found texts, as if they were simply a precious resource to be harvested, but, rather, to examine the texts as a whole—as part of a continuum—as representative of their time and artistic/cultural milieu. In short, BeardStair wished to find Barthes’s “weave of signifiers” throughout the artifacts, to sense these connections as a unified tapestry that might, with new light, elucidate an overlooked period of literary history.

Naturally, Barthes’s ruminations were quite complementary with regard to the BeardStair paradigm of collaboration. The reason for this was no coincidence, as BeardStair was, and is, deeply indebted to the core tenets of Digital Humanities studies as indicated in Dr. Harris’s (2013) recent article, “Play, Collaborate, Break, Build, Share: ‘Screwing Around’ in Digital Pedagogy, The Debate to Define Digital Humanities…Again.” Chiefly, the BeardStair participants employed collaboration, the willingness to explore multiple interpretations, and, equally important, a right to fail in the name of progress. There was always an essential need for fluidity in the BeardStair project—controlled, cohesive, cogent, yes, but absolutely fluid and adaptable. Digital Humanities is the only humanities field that affords that kind of freedom. Yet, even with freedom comes the inevitable burden of choice.

The BeardStair Project needed a medium with which to engage its audience. BeardStair wrestled with the idea of the “text,” vast as it was. Barthes provided a theoretical background, but there remained the issue of presentation from classroom conception to audience consumption. BeardStair had to choose between a digital archive of its texts or something more. The BeardStair participants’ understood that while a digital archive preserves and displays the material items along with secondary sources that relate to the items, they lack several fundamental elements, including the ability to include other scholars’ ideas in the discussion and to make an actual argument about the materials, which BeardStair participants found essential when it came to defining their project.

In their search for a method of defining the project that would include the fundamental elements they wanted to present, they confronted, in a different arena, the age-old question: what is a “text”? BeardStair considered displaying the texts online with findings and research, but that approach ignored the crucial, argumentative properties that BeardStair members thought important. BeardStair participants felt that if texts were merely collected, reproduced, and digitally stored, then the archival properties would not give the project the ability to develop a thesis and make an argument regarding the books’ intrinsic and extrinsic values.

The BeardStair participants acknowledged that by virtue of being archived, there would be an inherent argument about the books’ intellectual value. Whether one physically or digitally presents a text in an archive, one is making an argument about that text’s relevancy, importance, genre, and historical context. Yet an archive ostensibly grants an immense power of interpretation to archivist(s). BeardStair students were not convinced of such a strictly archival stance as such a position alienates the author from the historical context of the text, proposing that it may be manipulated for different purposes or motives from the original author’s intentions. In other words, the BeardStair project is motivated by the idea of disseminating the power of interpretation of value to a broader authorship that extends beyond the participants themselves.

Students who participated in the BeardStair project, in keeping with the spirit of Digital Humanities and collaborative efforts towards projects and arguments, wanted to utilize an approach that satisfied the efforts of the project while embracing the academic community and the public at large. Thus, BeardStair students decided to produce a scholarly edition. With a scholarly edition BeardStair participants were free to posit an argument without the risk of alienating or dismissing dissenting opinions. The scholarly edition functions much like an open forum—like any article of scholarship—in that it demands conversation, agreement or dissension aside. While the digital archive is honed and bent by the will of an individual, represented as truth, the scholarly edition represents the acceptance of plurality and the possibility for a true dialectic.

The BeardStair project is, fundamentally, constructed to be inclusive of the world at large. In support of such lofty goals, the project now has a working website, a digital mark-up protocol (TEI) for the text of an entire book, critical essays on all the books and artists, a project rationale (aforementioned), and a thesis that argues the value of the books’ place in the Modernist era.

As the semester progressed, BeardStair participants recognized a need for a Digital Humanities lab at SJSU and crafted a funding proposal highlighting the production needs for a project of BeardStair’s scope. Such projects are the realization of the potential of Digital Humanities studies and are essential to its survival, especially from an institutional/academic standpoint. BeardStair members are amazed and proud with what they have accomplished without funding support. The inclusion of a designated DH space could only bode well for future instantiations of the BeardStair Project.

The following is a complete project history of BeardStair to date. Much of the information here is drawn from blog posts on the class website, “The BeardStair Project: A Graduate-Student Driven Digital Project” (Coad et al. 2013). Here, in this boiled-down history, readers can immerse themselves in the origins of the Project and join the journey of the Spring 2013 collaborators. We’ve chosen to present the history in a chronological timeline so that others can read about successes and failures, and most importantly, engage with the process of creating an elaborate Digital Humanities project. It is the sincere hope of all of the BeardStair members, past and present, that readers of this piece will be inspired by what they read, our absolute commitment to collaboration, our fraternity of scholarship; we, BeardStairs, hope that the world—both academically inclined or otherwise moved by curiosity—will share in the joy of our labors, the successes and the failures we’ve had. It is our wish that this interactive history, full of images and links to course schedule and blogs, will inspire similar projects and adventures—that others might join us down the rabbit hole.

Project History

Early September 2011 Jesus Espinoza finds five rare books, not SJSU library property, left anonymously in the library return bin and flips through the profusely-illustrated pages. The images and the books’ quality remind him of an Honors Colloquium that he had taken with SJSU Digital Humanities and book history scholar, Dr. Katherine D. Harris. He brings the books to Dr. Harris and she determines the books’ handmade paper and uncut pages signal valuable book history. These books are original editions, yet far from pristine. Some are in better shape than others, but all show some signs of decay. However, the physical attributes of these books indicate the potential for valuable literary and historical examination relating to the method in which they were produced. Jesus immediately begins crafting a research project around these found books. Dr. Harris, Jesus, Colette Hayes (MLIS School of Library and Information Science student), Doll Piccotto (MA English), and Pollyanna Macchiano (BA English) form a volunteer research group that meets off-campus monthly. They discuss the books and uncover their mysterious past. The group decides the lavish color illustrations by artists Aubrey Beardsley and Baron Hans Henning Voigt (known simply as Alistair), should dominate the project. They decide to call their group, “BeardStair.” The group dreams of preliminary goals, the first of which is to exhibit the books in King Library Special Collections. The second is to construct a peer-reviewed digital edition, supported and maintained by the library and a scholarly community.

The Original BeardStair participants spend four months delving into every facet of the works – from their mysterious dumping into the SJSU library bin to the collective importance of Modernist artists’ books. The project beginnings are shared in detail at the blogging site, BeardStair.wordpress.com and in a fairmatter.com blog post called “Giving Students the Keys: Digital Projects” by Katherine D. Harris.

November 28, 2011 The “Student Driven Project: BeardStair” blog post at triproftri is acknowledged as an Editor’s Choice for Digital Humanities Now. BeardStair participants are inspired to find out that the Digital Humanities community is watching their pedagogical experiment.

February 23, 2012 Pollyanna Macchiano gives a presentation on BeardStair called “The Underground Voice in Digital Humanities” at THATCamp Pedagogy. The Digital Humanities community has begun to notice the BeardStair Project as a multilayered experiment in both old books and new ways of engaging with the humanities.

BeardStair-Figure-2-SVS-cover1

Figure 2. Sebastian van Storck Cover, 1927

BeardStair-Figure-3-Ballad-Cover

Figure 3. Ballad of a Barber Cover, 1919

BeardStair-Figure-4-Sphinx-Cover1

Figure 4. The Sphinx Cover, 1920


January 24, 2013: Phase Zero of English 204 Begins
Phase Zero marks the continuation of the BeardStair Project by SJSU M.A. and M.F.A. students in a classroom setting. Dr. Harris opens with the caveat that this is a collaborative learning environment and the group is encouraged to think outside of traditional humanities, collaborate, and embrace failure. To start, some assignments are posted to the blog site and the schedule of phases (a step-by-step plan of the collaborative work we want to accomplish throughout the semester, adhering to a set of codified student learning objectives introduced by Dr. Harris at the outset of English 204) is developed with the enthusiasm of meeting key semester objectives: By the conclusion of the course, we will have added to BeardStair Project and will (ideally) submit it for review by NINES, a peer-review entity for nineteenth-century digital projects. In essence, students will immerse themselves in the burgeoning field of Digital Humanities in order to contribute to a real-world scholarly publication. Working within a set of core student learning objectives (SLOs), the English 204 group sets out to accomplish goals by first conceding a few truisms, borrowed from Professor Matthew Kirschenbaum’s English 668k course website at the University of Maryland, which states that not all questions would have been answered; not all texts would have been read; all avenues of experimentation would not be exhausted; and the entirety of Digital Humanities would not be explored.  The inception of BeardStair embraces Kirschenbaum’s SLOs, but the execution of BeardStair, in its current form, is reflective of Dr. Harris’ English 204 SLOs in that the group functions as a collaborative unit with a final, multimodal project being created at semester’s end. Above all else, Project BeardStair was/is an experiment, with all respect and reverence given equally to success and failure.

BeardStair-Figure-5-What-we-did-on-our-first-day
Figure 5 “What We Did On Our First Day” Schedule of Phases

January 31, 2013 Phase One Begins, Research

The class discusses the definition of Digital Humanities, the essence of collaboration, and catches up on where the original BeardStair participants left off. They are introduced to the physical books and divide into two groups–the Technical Group and the Literary Group–with the objective of covering all project phases. Each group creates its own private Facebook group page for efficient communication, brainstorming, and sharing documents. These Facebook groups become instrumental in organizing, sharing ideas, posting documents, and keeping group members accountable. Facebook will become the single most effective method of collaboration the BeardStair teams use.

Figure-6
Figure 6. Tech Group Facebook Page

February 7, 2013 Team members continue to read and research the theory of Digital Humanities and what it means to do DH. They come to understand that the Digital Humanities involves the use of digital tools to represent material items and the secondary resources that discuss them. It’s determined that each week both Lit and Tech groups will prepare a blog post to share our process and document progress. The Lit Group’s initial action is to familiarize themselves with the Project, both the books and the research conducted by the original BeardStair members. They process this material into summaries so that, moving forward, research can be done without requiring use of the physical books. The Tech Group reviews several digital archives to discover positive qualities of functioning projects similar to BeardStair. These digital archives, however, appear to only present the primary materials and secondary documents and do not make a community argument about the value of the texts, something BeardStair participants believe is important to their project.

February 14, 2013 The class continues discussion on digital publications and determines that the category of publication the Project best fits into is “digital scholarly edition.” All class members write an individual blog on the “anxiety about sustainability, project management, productive unease, scholarly editing, or building.” Meanwhile everyone thinks seriously about how to define the BeardStair Project. The main question is: Are we creating a digital scholarly edition or a digital archive? They determine that digital scholarly edition best fits the Project type because they aim to present the materials, make an argument about their value, and allow scholars from the broader community to comment and make their own summations of the works, either in agreement or disagreement with BeardStairs’. A digital archive would meet the first two goals of sharing the works and secondary sources about the works, but it would not allow for input from outside the project members, which seems to go against the original values of the participants. The Tech Group begins “articulating a structure for our digital project” and creates GoogleDrive documents that contain features the Project should include. They consider using a timeline to articulate the project using Dipity.com. After looking into whether their books already have digital editions, and not finding any, they are reaffirmed in the value of this project. They consider working with The Internet Archive to house the digital editions. They also research metadata and advocate creating metadata for the Project. The Lit Group publishes materials to the class’s private Google drive, including summaries of each book, brief contexts, descriptive bibliographies, and the start of an annotated bibliography. Here, the group shifts from gathering and understanding the Project as it had been left by the original BeardStair participants into new areas of research guided by the class’s interests: publishing houses, materials, and the artist Alastair.

February 28, 2013 Phase Two Begins, Development
The class discusses mark-up and sustainability and discusses goals for the Development Phase. The group acknowledges the need for a thread between the books, a thread that can be explored in research and could be presented for publication. It is determined the class wants to get the Project online by the end of the semester, but they also see a need to present an argument rather than a haphazard publication of the materials. Following research leads Dr. Harris discovered through Twitter, the Lit Group decides the BeardStair books are actually part of the livres d’artistes genre, as defined in Johanna Drucker’s book, The Century of Artists’ Books (1995). The discovery’s significance is twofold: it begins to make cohesive each member’s different area of research, and the collaborative nature of livres d’artistes lines up nicely with the collaborative nature of the BeardStair Project, connecting the literary aspects to the larger discussions about Digital Humanities which seems to circle a debate about where the emphasis of DH should lie: on digital tools, or the people that use them? The Literary Group provides the first sketches the Project’s structure based on their research about livres d’artiste books. The Tech group researches mark-up and the Text Encoding Initiative. TEI is XML streamlined and requires knowledge of coding. It also has its own set of guidelines that requires assimilation of new rules and standards. The Tech Group determines that implementing TEI will require either an immense investment of time, or outsourcing, which would be problematic because it would cause us to lose control over the Project’s argument. This discussion of TEI leads the BeardStair participants to think about how they are going to define “text,” and what we want to accomplish with the texts we have. They look for advice and an understanding of “text” to James Cummings’s “The Text Encoding Initiative and the Study of Literature” (2008) and an article by Stephen Ramsay and Geoffrey Rockwell, “Developing Things: Notes toward an Epistemology of Building in the Digital Humanities” (2012) and come to the conclusion that “text” acknowledges a continuum of works that share connections. Essentially, this is how they explain how BeardStair is linking the disparate textual volumes they have used.

BeardStair-Figure-7-loose-sketch-of-development-phase
Figure 7. Loose Sketch of Development Phase

March 7, 2013 In the spirit of collaborative group work, they complete their first peer evaluations using the Association of American Colleges and Universities’ online Teamwork Value Rubric. Completing evaluations of one another’s work leads to a focused group assessment of how well the Lit Group is functioning. The result is a reinvigoration of collaborative effort, individual accountability, and renewed group dynamics after the group had struggled to cooperate. During this class meeting, the BeardStair participants discuss “epistemology” and “hermeneutics” in an ongoing effort to determine “What is our argument?” They brainstorm and establish goals for the entire Project, and determine what can be completed in the remainder of the college semester. They also discuss a possible structure for the Project argument.

Figure-8
Figure 8. BeardStair Website Dreaming… If time and money were no object.

The Tech Group works on two prototypes for the audience interface. One is an e-book style presentation, and the other is an html presentation. They continue to research TEI and markup and consider how much is realistic to include in this project considering the timeline. BeardStair participants are interested in the concept of the text as an “artifact.” The quality and production of the books is of interest as well, which seems to imply that the Tech group and Lit group are on the same page regarding the “material” thread. The Tech Group is reminded that the quality of BeardStair images must represent the materiality of the books. The Tech Group reviews The Omeka project developed by the Roy Rosenzweig Center for History and New Media at George Mason University and the Scalar project developed by the Alliance for Networking Visual Culture at the University of Southern California and find that the open-source scholarly publication projects offer a possible publication venue for BeardStair.

March 14, 2013 Phase Three Begins, Building
The BeardStair participants have been discussing what type of argument to make by asking questions about what they want the public to get out of their experience with the books. They ask, What do these books say? What does BeardStair want them to say? They determine that they would prefer a peer-reviewed publishing platform, but there is debate about whether the group will be able to pull together all the writings and materials in time for peer review. The group discusses using Scholarly Editing as the publication site. There is still ongoing discussion and inquiry about using Omeka or Scalar as publishing platforms. The Lit Group produces the first formal drafts of the context for the webpage and posts them to the Google Drive Master Documents folder. This brings about unanticipated questions of style and formatting. Members of the group also start thinking about the theoretical framework for the Project, mainly surrounding questions about the significance of the artwork present in the “commercial” livres d’artistes. The Tech Group is still working on a scanned version of the books and is determined to provide a facsimile showing the jagged edges and watermarks. They work to find the appropriate medium in which to convey these images, but the digital files for the Project are huge, the data is immense, and time is limited. BeardStair has made some progress in terms of types of digital tools and the kind of digital interactivity they want. They determined they need an HTML version and a PDF version of all books. One Tech Group member is learning XML/TEI markup, so it is possible that they could include an XML version by the end of the semester. They hope to include a flipbook viewer like DjVU or Daisy. They are also considering including a forum that allows viewers to post comments and ideas.

March 21, 2013 The group chooses a project historian to document successes and opportunities for the project’s About page. BeardStair participants are getting serious about avenues for online publication. Scholarly Editing has responded that they accept projects submitted with multiple authors or strict limitation on images. Lit Group has been in contact with Scalar to get advice on the use of Scalar as the BeardStair platform. It is unknown when Scalar will be available to the public. The Literary Group settles on Modern Language Association as a standard method of citation. This week also begins the editing stage. Each individual in the Lit Group shifts the focus away from his or her own writing to the writing of other group members. This also brings the focus of the Lit Group more to the end product, creating questions of scope, specificity, and breadth of research. The larger class asks the Lit Group to begin thinking about a thesis for the Project, which they are resistant to doing because they don’t feel research is complete yet. The Tech Group questions how much server space the digital edition will require and grapples with finding a host. The group leans towards Scalar, but still questions if they have enough hands or time to add detailed metadata. The project is still struggling with the large size of images required for publication. A mock-up of the website is developed for class discussion and review, and refreshes the class’s excitement and enthusiasm about the project. The Literary Group completes all formal drafts of contextual writing that both presents their research on the authors and illustrators related to the BeardStair Project and examines the value of artists’ books of the Modern period.

Figure-9
Figure 9. BeardStair.com Mock Up

April 4, 2013 The Tech Group chooses a new team leader to give another member the opportunity to have that responsibility. The BeardStair participants are now three weeks into what they had originally estimated would be the “building” phase of the Project. At its April 4th meeting, a small gathering of collaborators discusses the first draft of the Project rationale and the first draft of a Project history. This is a milestone in the Project because both groups felt directionless without a thesis to argue and move forward with. The group decides to look into creating a Kickstarter campaign to fund the Project, but at this point, one member buys server space to host the website because he sees the need to push forward. The Project tried to avoid this common Do-It-Yourself approach to the Digital Humanities, but funding opportunities are limited.

April 11, 2013 After much deliberation and collaboration BeardStair settles on a Project thesis: “We claim that these books act as autonomous literary and artistic objects that can be valued for their merits outside, and in spite of, their monetary direction.” This argument, that the books have intrinsic value, is a rebuttal to Johanna Drucker’s (2005) ideas about the genre that argue such artists’ books were only of commercial value. BeardStair will continue working on a Project rationale with the developing thesis in mind. Over the next week, they will also explore Omeka and its potential as a platform for the BeardStair Project online. BeardStair buys a domain name and some server space for the website www.beardstair.com. The group had discussed creating incentives for contributors who would donate to BeardStair Project through Kickstarter, such as early releases or expanded access. However, because BeardStair participants want the project to be freely accessible to all and have no intention of creating competition between outside contributors, but would rather increase collaborative efforts from the greater community, they decide against seeking funding through Kickstarter. Instead, they discuss putting a “donation” button on the web page to help recoup some of its out-of-pocket costs due to lack of departmental and university funding for Digital Humanities. Several BeardStair team members are continuing to learn TEI, though it’s a struggle. They try to gauge the amount of time it might take to create TEI for all the books’ content. The discussion turns to “big picture” ideas, particularly the lack of university funding for Digital Humanities. Dr. Harris proposes that team members work on a funding proposal for a DH center at SJSU. The proposal will need to touch on space, materials, and funding support needed for such a center. As importantly the proposal will need to address questions such as: Why have such a center? How would it enhance our education? How would a DH center help with the completion of a project like BeardStair? The BeardStair class also reorganizes the teams to reflect the new work-groups needed: TEI, Project History, Omeka Group, and Funding Proposal. The role of the BeardStair historians is determined as one that formulates a readable work that points to significant conclusions about the project’s process. The historian is not so much concerned with whether BeardStair meets its goals but more with the milestones that changed the process and evolution of the project. The team looks at several ways to share their history: a narrative, an interactive timeline, or a scholarly essay. Thinking realistically about the time left in the semester, the team settles on an interactive timeline with short narratives to elaborate on team milestones.

Figure-10-page-17Figure 10. BeardStair.com

April 18, 2013 Each group continues development of their sub-areas of BeardStair. TEI mark-up for the title page and header of Ballad of a Barber is completed and the TEI goal for the end of the semester is to create a header for each book and complete all TEI markup for Ballad of a Barber. The Project Historians comb through class notes, blog posts, and the class’s weekly schedule, along with reaching out to the original BeardStair team, to produce a cohesive history of the project. It is decided that at the second-to-last meeting, the group will discuss publishing on pedagogy in a scholarly journal. The funding group continues work on a draft of the funding proposal letter, and has contacted Costal Carolina University to ask for advice about creating a small lab. This week, the funding proposal group has shared an outline of its draft with the team in its blog post and asks for input and suggestions regarding goals and specifics.

Figure-11-page-18
Figure 11. Ballad of the Barber TEI Header


Figure-12-page-19
Figure 12. The BeardStair To-Do List for Week 10 of 14 for the Spring Semester

April 25, 2013 The week begins with a discussion on the Team Rubric Evaluations each member will complete for all class members at the end of the semester. Also the BeardStair participants are asked to prepare a blog post for the final week of class addressing skills–both hard and soft–learned in the class. The funding group creates a spec-list for a potential Digital Humanities center, using its own Incubator Classroom and other DH centers as examples. The Omeka group arrives at an adequate solution to the problem it has had with pictures, and can now represent the photographed texts in their entirety as PDF documents. Omeka–a free open-source platform that appears to have a large and dedicated enough following that it should remain supported for some time–looks viable, and the group has hosting space ready. Implementation should require incorporating BeardStair’s aesthetic and functional ideas into the Omeka site. The historians have settled on using a timeline with short narratives as the format. This should be a concise and navigable way to highlight project milestones. Dr. Harris has been diligent about recording weekly events, decisions, and discussion topics; and the groups have also been consistent about posting blog entries that we have been drawing from to write the project history. The TEI group continues with its learning tutorials. They are eager to learn the text encoding protocol, but admit progress is slower than they had hoped it would be. Their hope is that they will each be operating on the same level of proficiency soon, and will be able to reach their semester goals.  

May 2, 2013 Phase Four Begins, Publication
Original BeardStair founding member, Jesus Espinoza, joins the team for the meeting, and hears a presentation about the semester’s activities. The historians share their latest draft and ask for the group’s input. The group sees a mockup of the BeardStair’s Omeka site. There is a draft of the project rationale, and the group is asked to review and provide feedback during the coming week. The meeting concludes with some things to think about: What will the next instantiation of this group do? Where does the next team pick up the BeardStair Project, and where will they take it? The TEI group uses several new tutorials (www.codeacademy.com and www.w3schools.com) and reports learning has become easier, though the TEI process is still time-consuming. The header for Ballad of a Barber is done, and coding of the text is underway. TEI headers for The Sphinx and Sebastian van Stork will follow. The funding proposal group drafts several proposal letters for various audiences. They work to revise the funding letter to the SJSU Humanities and Arts dean and identify and revise it for specific audiences, such as national grant making organizations. They ponder how to communicate the exciting possibilities of a SJSU Digital Humanities center and how to articulate the purposes of the DH Center.

May 9, 2013, Last Meeting of Spring 2013 The team is required to revisit the idea of “done” and reads the Digital Humanities Quarterly essay “Published Yet Never Done” (Brown et al. 2009). Regardless, the BeardStair team members cram to meet goals and deadlines before the end of the semester. They review the written documents on all books, check the Omeka mock-up and read and comment on the Project Rationale. The TEI group brings the headers for each book and a complete mark-up of Ballad of the Barber will be ready by the conclusion of the course. The Funding Group has a strong draft of the funding proposal and a final draft of the Project History will be ready by May 16 for the faculty advisor’s comments. The group is still thinking about sending one TEI book with documentation to Scholarly Editing. Also, each BeardStair team member is privately working on a Team Value Rubric for one another to assess each individual’s contributions to the Project and effectiveness as collaborators.  Everyone has been working on a To-Do list for the next installment of BeardStair so the torch can be passed efficiently and the goals of the original BeardStair participants and this graduate class stay in sight.

Conclusion

The BeardStair Project started with the discovery of five old, rare books in the San Jose State University Library. Who dropped them in the returns box? Are they valuable? What are Artists’ books anyway? The new, impromptu custodians of the books dubbed themselves BeardStair and their curiosity quickly grew into a passion. They wanted to know everything they could about the books as soon as possible. To support that passion, they developed a set of informal values surrounding their exploration. Those values–deep respect for the books and an enthusiasm to share them with the greater community–have been passed from one iteration of the BeardStair Project to the next. The exploration of Modernism, the livres d’artistes genre and the desire to illuminate the works for the academic community is nothing new to the School of Humanities. What is emerging in the school, and what the original BeardStair participants naturally found in themselves, is the desire to make the works accessible to all, online, for free, in a live discussion. This passion for sharing the books’ intrinsic and extrinsic value has become the most important aspect of Digital Humanities for the BeardStair participants. The BeardStair Project itself had a rocky and intermittent start. Originally, the team performed informal research and met for dinners to discuss findings. After months of what their adviser referred to as “down the rabbit hole” enthusiasm, the team of volunteers found that for the project to meet the goals they had set based on their values, the project would need more nurturing than they could give. They simply didn’t have the labor power, technological resources, funding, or university backing to get the books onto the web and out to the world. This under-resourcing problem seemed to point to possible approach to the Digital Humanities that could result in the completion and continued growth of projects: collaboration.

When the Spring 2013 graduate class took over BeardStair in January, they had more technology (though still, a full service DH lab remains a dream), they had almost three times as many people working collectively, and they had some, albeit minimal, university backing. (SJSU provided an incubator classroom and granted course units toward individual Master’s degrees.) Several aspects of working collectively quickly became essential to the new team. They developed project phases and To-Do lists to keep them moving toward their goals. They assigned strong leaders and used technology to communicate regularly and to hold themselves accountable for individual deadlines. They used teamwork rubrics as a way of getting and giving feedback to their peers. The collaboration itself was a powerful tool for moving forward with BeardStair, but perhaps the most important value the team developed was unabashed creativity which was unencumbered by the fear of failure and the fear of incompletion. Letting go of the long-held belief that one must finish a project to be successful allowed the team to create new ideas of expression and take the presentation of the books on a new path, a path that better represents the value of the books themselves. While the Spring 2013 team did not accomplish every one of their goals for the semester, they did learn to see that BeardStair, as a Digital Humanities project, is an organic, living thing. The team finished their semester with a To-Do list that enabled them to pass the torch to the next generation of members who hopefully will develop their own values, creativity, and goals for the project. Additionally, from the university perspective, the Spring 2013 graduate-level Digital Humanities class was a success.

While there may be few tangible products generated by the class, it’s clear by looking at the project history that each of the San Jose State University English Department student learning objectives was met. Students gained a more complete understanding of the Modernist period and the literature it generated. They completed significant amounts of research and produced critical write-ups of their findings that will be posted online with the project. Also, they were very prolific with the written word and their own interpretations of Digital Humanities through their weekly blog posts. Dr. Katherine Harris blogs extensively on the SLOs in relation to the conclusion of the 2013 BeardStair Project class in her fairmatter.com blog post called “BeardStair.” From the perspective of the students who participated in the Spring 2013 Digital Humanities class at SJSU, the class offered learning opportunities beyond the English Department student learning objectives. Collaboration, resolving conflicts with peers, spearheading projects without the overt influence of a faculty adviser, and giving new meaning to the essence of what it means to “finish” a project, were among the skills learned in the BeardStair class. These skills are applicable in both academia and the greater working world. Each student who participated, and whomever will participate in the future, in projects like BeardStair knows the value of the Digital Humanities and what they offer in the university setting.

Appendix: Blog Notes on Collaboration from the 2013 BeardStair Participants

The Excitement of BeardStair by David Coad
“From when I first asked Dr. Harris to explain what her Digital Humanities class would be like, to the first day of class, I entered this class with a great excitement to build something digital in a working, collaborative environment. When we got to working, I got a little lost some weeks, not seeing the big picture, and thus, not knowing the best way to contribute to it. However, as I pushed forward, I found that working collaboratively in a (sometimes confusing, but) always rewarding environment, I found that working with others to make a digital argument was something that I wish I had the experience of much earlier in my academic career.”

Reflexion by Jonathan Cook
“I have a sense of accomplishment; I feel proud of what I have done. Perhaps more important than that, I am proud of those with whom I have collaborated, and, with what they—we collectively—have accomplished, I am content to have found myself in the midst of a such an agreeable lot, as they were willing to push me as much as I was willing to push back. The result, no matter how far removed from the ideal, is far more gratifying than any exam or composition exercise or recitation of tired ideas could be.”

Reflections on Building a Digital Project by Valerie Cruz
“It is my hope that the next group to take up the BeardStair Project will be able to gain funding and complete the digital scholarly edition that we have started. Although, we were able to put an edition online; it does not have all of the digital aspects that we would have liked to get our thesis fully across. I also hope that future classes will be able to do similar projects on other texts once this one is finished, and that they would possibly be able to do projects in collaboration with other departments within the Humanities.”

Personal Reflection and the Argument Against ‘Get ‘Er Done’ by Kelly Curtis
“There is one major difference with this class than my other classes as SJSU. In my other three classes this semester, I’m turning in something that is done. I’ve done the research, the writing, the proofreading, and I’m done – here ya go – goodbye. In Digital Humanities we did all the work, research, writing, proofing, and there’s more to go. This Project will never be done, because it’s digital. It’s a mold-able modality.

“But, with projects like BeardStair, I would like to see the word ‘failure’ eventually work its way out of the language. I understand it’s there to protect students from anxiety should they not reach all their goals. It’s the same reason we called our dreams ‘dreams’ and goals ‘goals,’ but we’re not failures because we only accomplished so many of the tasks on our list, nor are the Original BeardStair participants because they didn’t get the Project to take flight. In fact, we, as are they, are part of something bigger. They we’re the spark, we were the problem solvers, and the next installment of BeardStair Project, well, they’ll refine and continue. They’ll take the Project in their own direction.”

BeardStair Reflection by Dylan Grozdanich
“Well, here we are at the ‘end’ of our BeardStair Project. It’s been an interesting and slightly frustrating ride for me on a personal level. The most obvious frustration has been the idea of the ‘final project.’ We never had a final format for our research and have not implemented a template anywhere at the moment. It’s slightly annoying on some level. This though has been the way the Project has gone.”

Reflecting on a DH Course by Randy Holaday
“From this class, I learned that the perspective of a Digital Humanist necessitates advanced understanding of a piece of literature, and thus becomes part of that ‘range of theoretical frameworks’ us graduate students are expected to understand and utilize…Digital Humanities is a different framework for understanding literature. For example, our work with creating mark-up language for the digital editions of the BeardStair books creates and translates our unique argument to an audience far more diverse than a classroom.”

Reflection by Amanda Kolstad
“My experience with collaboration had previously been limited to undergraduate “group projects” which usually ended with me doing the majority of the work.  So, I walked into a huge challenge; this class was collaborative and technological, so I tried to let go of control and tried to just ‘let it happen.’ … I struggled… I struggled a lot… Because I was so used to working alone, and only being accountable to myself, I decided ‘not to bother my group until I found something worth sharing.’  This was not a successful choice.  Without communication about my process and progress, my group was left believing that I wasn’t contributing.  This was perhaps my biggest challenge with the course; I had to learn to communicate, even if I felt like I had nothing to report.

“My group struggled at our mid-semester check-in.  We were struggling with the collaborative elements and communication, and tensions were running high… After some difficult and honest conversations, the Literary Research group redoubled our efforts.  We checked in weekly, even if we didn’t have much to report.  We divided tasks, but we also worked in partners to edit each other’s work.  We shared research, we established a Facebook group; in short we moved our relationships with each other out of the class room and into our real lives.”

Some (Almost) Final Thoughts on the BeardStair Project by Alexander Papoulias
“Certainly, our whole semester has been about creating a thesis argument and using the research we’ve done to support it. What made the first half of the semester so nerve-wracking for us perfectionists, was doing research and writing before the thesis was formulated, and not knowing to what end we were researching and writing. That’s where patience with the process comes in. Flying blind for a while, and trusting that the quality of the team and its work will yield something valuable.”

Reflecting on BardStair by Ilyssa Russ
“Many of the other reflections talk about the process, but I guess I want to talk about the emotional “letting-go” I sort of feel. It’s hard to give this Project up, especially when you’ve invested so much of your time and energy into FIGURING OUT something completely foreign from the start. I’m hoping future BeardStairs can feel the same passion about this Project as our group did.”

Personal Reflection by Genevieve Sanvictores
“While the course definitely examined the question of how the humanities can embrace technology, I think that first and foremost it has been an experiment in collaboration. In many of my other graduate seminars research is done privately and papers are produced in solitude. While students often share their paper proposals and results in class, the work is left entirely up to the individual student.

“One thing that I have to say was difficult (yet rewarding) was dealing with failure. We initially had grand dreams for our project. We wanted to produce a digital scholarly edition that would razzle and dazzle. Then reality hit. Not only did we face time constraints, but we also faced challenges with funding, sustainability and lack of technical skills. We had to find a way to embrace not being able to finish, which I think, is a very difficult concept for a graduate student to accept.”

Screen-Shot-2013-10-30-at-11.11.37-AM
Figure 13. Spring 2013 BeardStair Members

Bibliography

Beardsley, Aubrey. 1919. The Ballad of a Barber. H. Princeton, NJ: Schiele. OCLC 11178111 Barthes, Roland. 1978. “From Work to Text.” Image-Music-Text. New York: Hill and Wang. 155-64. OCLC 53211219

Brown, Susan, Patricia Clements, Isobel Grundy, Stan Ruecker, Jeffery Antoniuk, and Sharon Balazs. 2009. “Published Yet Never Done: The Tension Between Projection and Completion in Digital Humanities Research.” Digital Humanities Quarterly 3 (2). Accessed October 18, 2013. http://www.digitalhumanities.org/dhq/vol/3/2/000040/000040.html

Coad, David, Jonathan Cook, Valerie Cruz, Kelly Curtis, Dylan Grozdanich, Randy Holaday, Amanda Kolstad, Alexander James Papoulias, Ilyssa Russ, Genevieve Sanvictores, and Erik White. Faculty Advisor Katherine Harris. 2013. “The BeardStair Project.” Accessed May 16, 2013. beardstair.wordpress.com.

Cummings, James. 2008. “The Text Encoding Initiative and the Study of Literature.” In A Companion to Digital Literacy Studies, edited by Susan Schreibman and Ray Siemens. Oxford: Blackwell. OCLC 259753413.

Drucker, Johanna. 1995. The Century of Artists’ Books. New York City: Granary Books. OCLC 33826276.

Harris, Katherine. 2013. “Play, Collaborate, Break, Build, Share: ‘Screwing Around’ in Digital Pedagogy, The Debate to Define Digital Humanities… Again.” Polymath: An Interdisciplinary Arts and Sciences Journal 3 (3): 1-26. Accessed September 28, 2013. https://ojcs.siue.edu/ojs/index.php/polymath/article/viewFile/2853/884

Ramsay, Stephen and Geoffrey Rockwell.  2012. “Developing Things: Notes toward an Epistemology of Building in the Digital Humanities.” In Debates in the Digital Humanities, edited by Matthew K. Gold. (Minneapolis: University of Minnesota Press). OCLC 759909869.

Pater, Walter. 1927. Sebastian Van Storck. London: John Lane. OCLC 2362195. Wilde, Oscar. 1920. The Sphinx. London:  John Lane. OLCL 5777162.


About the Authors

David T. Coad is a PhD student at UC Davis in Education with an emphasis in Writing, Rhetoric, and Composition Studies. He is interested in multimodal rhetoric, social media, and writing pedagogy. David graduated from San Jose State University with an MA in English, where he was grateful to get to work on the BeardStair team, and has recently been published in <i>Kairos</i> and presented at CCCC.

Kelly Curtis will receive a Masters in Fine Arts in Creative Writing from San Jose State University in December 2013. Her interest in the Digital Humanities lies with collaborative authorship, exploring new methods of presenting ideas and materials, and creating open source projects that are available to the broader community. She is currently seeking publication for her first novel and opportunities to collaborate on projects with other writers.

Jonathan Cook is currently working on his MFA in creative writing at San Jose State University. His areas of interest include Post-Structuralism, Deconstruction, Hermeneutics, and Existentialism—especially from thinkers like Barthes, Derrida, Camus, and Sartre.


Afterword: The DML and the Digital Humanities

Kimon Keramidas, Bard Graduate Center

While reading through this chronicle of our experiences , there is a particular term that may be conspicuously absent depending on the particular realms of academic discourse you follow: digital humanities. Digital humanities as a concept has rocketed to national prominence in recent years as both a legitimate movement and a buzzword of questionable deployment. While I don’t want to fully engage with the complexities of its history or the nuances of its varied interpretations,1 I want to explicate a little of why it is absent, because its absence is intentional, and it relates to the sense of considered timeframes I touched upon when discussing the challenges of the digital-born QP.

Perhaps the biggest challenge of truly penetrating digital media to the far edges of an institution is eliminating a sense that work done using digital media is distant and apart from the work people have done and are doing. This type of work needs to seem new and exciting, but it also needs to seem natural and progressing from a historical arc that has weathered many similar evolutions in technology and academic practice. Digital media are just a new set of tools after all, and different sets of new tools have had an impact on teaching and learning for as long as there have been such things.2

This desire for widespread acceptance and wholesale institutional integration is unfortunately at odds with a good part of digital humanities rhetoric, which in a political move is often situated in a position distant or apart from, and in some cases even antagonistically against, more traditional humanities work. Take for instance the Digital Humanities Manifesto 2.0, which claims that digital humanities as a phrase should be rejected “to whatever degree it implies a digital turn that might somehow leave the Humanities intact: as operating within same stable disciplinary boundaries with respect to society or to the social and natural sciences that have prevailed over the past century.”3 In this sense, digital humanities can be seen as a movement that seeks a break, and the Digital Humanities Manifesto 2.0 as a document meant to invigorate the frustrations that wish to shatter traditional humanities work.

Even in its more harmless incarnations, digital humanities can come to be an umbrella term for issues that are impacting all of academia but have been particularly vexing and/or interesting to humanities scholars frustrated with dominant traditional humanities practice. In an interview on HASTAC.org, Brett Bobley, Director of the Office of the Digital Humanities for the National Endowment for the Humanities includes these things as activities that constitute digital humanities practice:

open access to materials, intellectual property rights, tool development, digital libraries, data mining, born-digital preservation, multimedia publication, visualization, GIS, digital reconstruction, study of the impact of technology on numerous fields, technology for teaching and learning, sustainability models, media studies, and many others.4

Notably this list includes few activities that are applicable specifically to humanities research questions, and in fact reads more like a list of pan-disciplinary concerns and technologically impacted possibilities that are equally relevant to the sciences and social sciences, and in fact to practices outside of the academy as well.

This is not to say that there is not good work being done under the banner of digital humanities. Work on curricular and community development in the digital humanities by researchers such as Lisa Spiro5 is helpful in establishing practices similar to those we have developed at the BGC. There is also a wide array of centers and initiatives, such as George Mason University’s Center for History and New Media (CHNM) and HASTAC, that fall under the umbrella of digital humanities and have very similar missions and distinguished records of accomplishment.

But the term remains too contested, too fractured, and too frequently held up as a banner for radical change to be safe enough in the development of digital practice across an entire institution and with a wide range of constituencies. Because of its connections to such particular ideologies, it can become one of those dangerous flashpoints that inadvertently turns people away from a project that is focused more on the evolution of humanities methodologies and forms of practice than a radical dissolution and reconception of humanities research. So, no how matter how much I find work done by a self-labeled digital humanist useful in helping to shape our program or deploy tools, such as Zotero and Omeka, that are developed by digital humanities centers such as CHNM’s, we continue to use the term sparingly and cautiously at the BGC.

This is a time ripe for radical rethinking of many aspects of academic structures, and digital tools may in fact help hasten that process and be the impetus for real structural change. But our local mission is to provide the humane cyberinfrastructure within which the BGC community can learn to master those digital tools, rather than to champion a specific ideology or stance within that change. We may have opinions as to where those tools might lead academic practice, but the most powerful pedagogical move we can actually make is providing individuals in our community with the resources and knowledge to explore the field on their own and make their own decision about the direction in which they would like academia to head.


About the Author

Kimon Keramidas is Assistant Director for the Digital Media Lab at the Bard Graduate Center where he is responsible for the development and implementation of digital media practices across academic programs. His research focuses on digital media through the lenses of political economy and sociology of culture, and he is currently working on a book project about contemporary corporate theatrical production and a gallery project on the materiality of computer interface design. Kimon received his PhD in Theatre from the CUNY Graduate Center where he also completed the CUNY Graduate Center’s Certificate in Interactive Technology and Pedagogy.


Notes

  1. To get such a lay of the landscape of digital humanities see Patrik Svensson, “The Landscape of Digital Humanities,” Digital Humanities Quarterly 4, no. 1 (2010), http://www.digitalhumanities.org/dhq/vol/4/1/000080/000080.html.
  2. Plato’s concerns about writing Phaedrus, the impact of the Gutenberg press, and more recent anxieties over how Microsoft Word would change writing all show that there is a long history of concerns about how tools and technological capabilities change academia and society.
  3. Jeffrey Schnapp et al., “The Digital Humanities Manifesto 2.0,” June 22, 2009, http://www.humanitiesblast.com/manifesto/Manifesto_V2.pdf.
  4. Kathleen Smith, “Q&A with Brett Bobley, Director of the NEH’s Office of Digital Humanities (ODH) | HASTAC,” HASTAC, February 1, 2009, http://hastac.org/node/1934.
  5. See Lisa Spiro, “Getting Started in Digital Humanities,” Journal of Digital Humanities, March 10, 2012, http://journalofdigitalhumanities.org/1-1/getting-started-in-digital-humanities-by-lisa-spiro/ and Lisa Spiro, “‘This Is Why We Fight’: Defining the Values of the Digital Humanities,” in Debates in the Digital Humanities, ed. Matthew K. Gold (Minneapolis: Univ Of Minnesota Press, 2012), 16-35.

Philosophy through the Macroscope: Technologies, Representations, and the History of the Profession

Chris Alen Sula, Pratt Institute

Abstract

Macroscopes are tools for viewing what is too large, complex, or dynamic to perceive with the naked eye. This paper examines the use and history of macroscopy in philosophy to represent ideas, trends, and other aspects of the field. Particular emphasis is given to the growing Phylo project, which combines data, user collaboration, and visual analytics to advance the study of philosophy. This paper also presents two pilot studies focused on unique aspects of Phylo: one on the perceived importance of social connections in philosophy and the other on information visualization and academic philosophers. The second study, in particular, points toward several recommendations and areas of further research, and underscores the value of macroscopy in representing the field and suggesting interventions.
 

Few episodes in the history of technology are as curious as seventeenth-century opinion surrounding the first microscopes. Robert Boyle, an early proponent of microscopy, claimed he could prove his theory of color perception if only he “were sharp-sighted enough, or had such a perfect microscope,” as to discern the surfaces of objects ([1663] 1755 Vol. 5, 680). Robert Hooke announced that, now, “nothing is so small, as to escape our inquiry” (1665, Preface). Enthusiasm for the tool was so complete that the early microscopists were more focused on discussing the design, construction, and performance of their inventions than on making biological observations with them (Bracegirdle 1978, 8). “By 1692,” Catherine Wilson reports, “Hooke was already complaining of reaction against the microscope, of boredom and disenchantment” (1995, 67). Not until the nineteenth century did microscopy inspire a school that carried on the tool—this time with scientific results (Singer 1970, 382).1

Nearly three centuries after the microscope was invented, Joël de Rosnay noted the emergence of a new tool: the macroscope. “The macroscope is unlike other tools,” he warned. “It is a symbolic instrument made of a number of methods and techniques borrowed from very different disciplines…It is not used to make things larger or smaller but to observe what is at once too great, too slow, and too complex for our eyes” (de Rosnay 1973, xiv). Within de Rosnay’s sights were topics of energy and survival, information and society, and time and evolution—systems-level phenomena that elude casual perception and exhibit various interaction effects between their constituent elements.

In contrast to the microscope, which was turned on tiny bits of matter, de Rosnay claimed that the macroscope would be focused on ourselves: “This time our glance must be directed towards the systems that surround us in order to better understand them before they destroy us” (xiv). Whereas the microscope was a tool of enhancement and understanding, the macroscope would also be an important tool of action. “Let us use the macroscope,” he urged, “to direct a new look at nature, society, and man to try to identify new rules of education and action” (xiv).

Whether the macroscope(s) will follow the same course as the early microscopes—disuse, disenchantment, delay in adoption—remains to be seen. One suspects its use in fields such as ecology, economics, or evolutionary biology (the principal fields de Rosnay examined) has been enthusiastic and substantive. Whether those in the humanities have embraced the tool is another matter. A telling example may be Franco Moretti’s Graphs, Maps, Trees: Abstract Models for a Literary History (2005). As opposed to the close (microscopic?) readings of a single text that typify literary scholarship, Moretti employs a “distance reading” (macroscopic) method: “instead of concrete, individual works, a trio of artificial constructs—graphs, maps, trees—[is used] in which the reality of the text undergoes a process of deliberate reduction and abstraction….fewer elements, hence a sharper sense of overall interconnection. Shapes, relations, structures. Forms. Models” (1). While Moretti’s work is regarded by many as revolutionary, even he describes it as a “specific form of knowledge,” and Emily Eakin calls  Moretti’s approach a “heretical blend of quantitative history, geography, and evolutionary theory” in her review of the book (New York Times, January 10, 2004)—perhaps suggesting that it is not literary or humanistic at all.

This marginalization is a fate for the macroscope that I wish to avoid.  In the same pragmatic spirit in which de Rosnay advanced this tool, I suggest that the macroscope affords a wide and unpredictable range of applications across disciplines, including opportunities for understanding the ways in which ideas and knowledge are produced and exchanged, especially in the formal and structured channels of academia. This approach is interdisciplinary, requiring a hefty dose of empirical methodology that is not beyond the scope of criticism. As Cathy Davidson points out, “Data transform theory; theory, stated or assumed, transforms data into interpretation. As any student of Foucault would insist, data collec­tion is really data selection. Which archives should we preserve? Choices based on a com­plex ideational architecture of canonical, institutional, and personal preferences are constantly being made” (2008, 710). Though critical perspectives on empiricism should not be lost, it is equally misguided to allow them to paralyze knowledge construction, especially where new methods and their applications are concerned. In such cases, it is worth suspending critical concerns provisionally for the sake of further inquiry. An analogy with engineering is helpful here: whatever the epistemic status of a set of scientific facts, those facts may still help build bridges, launch rockets, or cure diseases. In the end, this pragmatic test may be sufficient to justify a place for those facts in what is considered knowledge; if not, at least we are left with rockets, vaccines, and other technologies. So too, the macroscope as a tool may yield interesting and useful results, and epistemological questions may be reserved for a later date, once some results are in.

This paper introduces a macroscopic view of philosophy by discussing Phylo (http://phylo.info), a developing, interactive search tool that will visualize connections and trends between individuals, institutions, and ideas in philosophy. To provide a context for this tool, I begin by surveying past and present attempts to represent philosophy, noting the technologies and media involved in each, as well as their merits and limitations. Following this historical review, I discuss the data and interface for Phylo in greater detail, paying particular attention to two unique aspects of Phylo: its focus on social connections and its use of information visualization. I then present the results of two surveys that separately address each of these aspects. The first survey focuses on social connections in the field and the importance philosophers ascribe to them in their research. The second survey is a pilot study in which philosophers were asked to interact with macroscopic representations of the field and report their experiences. The data from these studies support the overall approach taken with Phylo and suggest several ways in which macroscopic representations might be refined to aid comprehension and facilitate user interaction.

It should be noted that this paper acts as a précis to the macroscopy of philosophy as a whole. In a fuller treatment, it would be necessary to address the modal aspects of philosophy (e.g., philosophers, institutions, schools, ideas) separately by discussing past and possible representations of each in detail, as well as empirical research on various types of visualizations. In this paper, I discuss the field cross-modally, switching liberally between representations of people, places, and ideas in philosophy. My immediate goal here is to demonstrate the power of the macroscopic perspective, and for that purpose, a wide swath of material will suffice.

Representing philosophy

In a macroscopic sense, representations of philosophy present top-level, abstract views of the field, either generally or for some particular subfield of philosophy or topic area. In some cases, they are created to give introductory overviews to orient non-specialists to the history and content of ideas. In others, they are tools for facilitating research or advancing substantive views about the development, merit, and trajectory of particular schools, movements, ideas, and arguments. Representations of philosophy tend toward the textual; few visual examples exist. Still, it is worth surveying the variety of examples and their merits to inform the design of current, macroscopic representations of the field. Since macroscopy will, to some extent, rely on empirical methods and quantitative analysis, it will be helpful to place historical representations within the framework of figure 1, which is based on idealized poles of purely quantitative and purely qualitative representations. This figure also positions three general categories of textual representations (narratives, encyclopedias, bibliographies), as well as the few instances of visual representations, all of which are discussed in greater detail in this section.

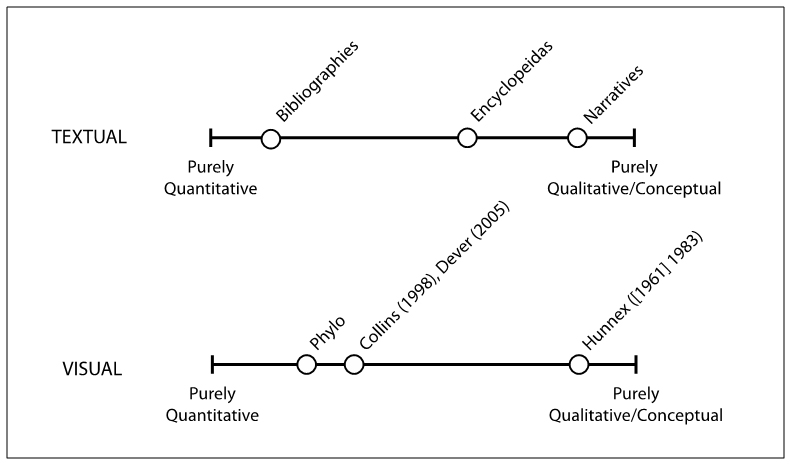
Figure 1. An organizational framework for representations of philosophy.

In assessing these types and representations, it will be helpful to consider issues of neutrality and completeness. Creators of representations are forced to decide not only which material to include and which to exclude (the selection problem), they are also burdened with categorizing that material in particular structures (the organization problem). Both of these processes involve some amount of bias that, to varying degrees, compromises the ideals of neutrality and completeness to which these representations aspire. Of course, it may be equally naïve to suppose that any nonbiased representation of the field is possible. Still, a survey of these representations and their limitations can prove instructive for discovering ways to reduce bias and harness new technologies in the service of more neutral and more complete representations.

Narrative representations

By far, narrative accounts form the most common representations of philosophy and are the stock and trade of most historians of philosophy. In the past decade, significant attention has been given to contemporary analytic philosophy with such notable works as Scott Soames’ two-volume Philosophical Analysis in the Twentieth Century (2003), Avrum Stroll’s Twentieth-Century Analytic Philosophy (2001), and the American Philosophical Association’s Centennial Supplement to the Journal of Philosophical Research, Philosophy in America at the Turn of the Twentieth Century (2003). These and other narratives tend to portray the field in terms of key figures and major movements, leaving aside the minor figures that, in Randall Collins’s view, form the social structure crucial for disseminating ideas: “To speak of . . . a little company of genius would be to misread the sociological point entirely. It is the networks which write the plot of this story, and the structure of network competition over the attention space, which determines creativity, is focused so that the famous ideas become formulated through the mouths and pens of a few individuals” (1998, 78). Collins chooses to represent the field in terms of maps of social connections, which I discuss in a later section on visual representations.

In evaluating narrative accounts and Collins’ criticism, it is worth recalling Marshall McLuhan’s rejection of the notion that content or ideas are simply delivered through the use of various media. On the contrary, “it is the medium that shapes and controls the scale and form of human association and action” (1994, 9). If McLuhan is correct, understanding these delivery methods is at least as important as understanding their actual content, and representing the field strictly in terms of ideas excludes the vehicles by which those ideas are propagated or silenced—the vehicles which also shape and transform those ideas. This fact has long been appreciated by bibliometricians who study patterns of authorship and citation within scholarly book and journal communication. Presently, this research suggests that social connections play an important role in determining co-citation patterns in which two authors cite one another (White, Wellman, and Nazer 2004; Pepe 2011). One must approach these studies with caution, however, because most bibliometric research has been based on scientific literature and citation patterns have been found to differ across disciplines (Lancho-Barrantes, Guerrero-Bote, and Félix Moya-Anegón 2010). Humanists, in particular, are known for crediting each other less frequently than scientists (Hellqvist 2010), but marked patterns of co-citation still exist in the humanities (Leydesdorff 2011) and humanists have begun to credit each other more frequently over time (Cronin, Shaw, and LaBarre 2003). While the full influence of social connections on all citation patterns in the humanities is not fully known, omitting these connections and the minor figures that serve as bridges, liaisons, and transmitters weakens the power of most narrative representations. It is important to note that this weakness is perhaps more the fault of the narrative form itself than that of particular authors; a narrative structure seems ill suited for recording a high volume of connections between people (about whom little else may be known). With this criticism in mind, it is worth reviewing more quantitative textual approaches that may be capable of representing the high-volume data required for macroscopy.

Bibliographic representations

General bibliographies of philosophy date back as early as the fourteenth century, though Johann Jacob Frisius’s 1592 bibliography may be regarded as the pioneer of the form, which was followed for several centuries by larger compendia. As Michael Jasenas notes, these bibliographies all contained some amount of bias: “minor authors whose writings were related to the curriculum of a university often had more chance of being listed in the bibliographies of philosophy of the time than a philosopher whose views were so advanced that they remained for a while peripheral to the field” (1973, 41). The last of these general bibliographies came in 1905 with Benjamin Rand’s massive compilation, which contained over sixty-thousand entries and has been succeeded only by more limited subject bibliographies. While Rand’s bibliography gave exhaustive coverage of the nineteenth century, it still reflected the compiler’s strong interest in psychology, which spans nearly a quarter of the entire work—more than logic, aesthetics, philosophy of religion, and ethics combined. Indeed, Gilbert Varet’s ambitions for an “indiscriminate” catalogue remain unfulfilled to this day.2

Beyond problems of inclusion and exclusion, these bibliographies also suffer from various limitations imposed by their printed form. One is the need to aid users in finding sources: Should entries be arranged alphabetically or chronologically? By author/philosopher or subject matter? Should entries be cross-listed (perhaps with a limit on the number of times one source appears)? These questions were most commonly answered with subject classifications such as metaphysics, aesthetics, and ethics. These classifications, however, exhibit biases similar to those involved with inclusion and exclusion of sources. As Jasenas notes: “philosophy has always been in a state of flux, with differing conceptions of scope and interest prevailing at different times. In classical antiquity philosophy encompasses almost all fields of knowledge; but later many of them gradually became separated from philosophy as independent disciplines. Consequently, the history of the subject is largely colored by the continuing tendency to re-define and emphasize special areas of interest formerly included in larger definitions” (12). A variety of historical classifications is presented in figure 2 below.

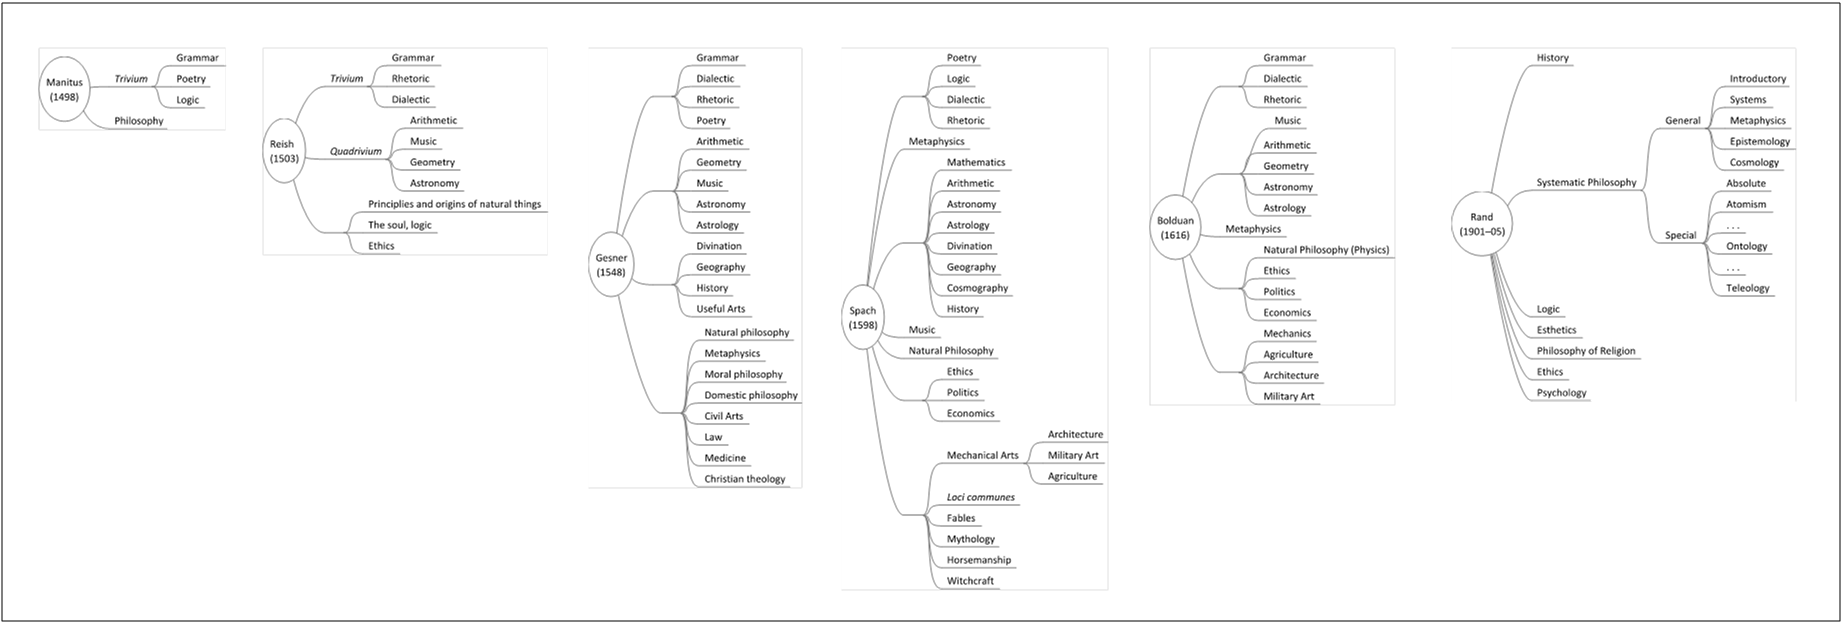
Figure 2 (Click to Enlarge). Comparative diagrams of selected bibliographies of philosophy from 1498 to 1905.

Though there is noticeable overlap between these classifications (e.g., inclusion of the trivium and quadrivium across several centuries), the differences are also telling, both in terms of the position of certain subjects within the author’s taxonomy and the presence or absence of certain subjects (e.g., medicine, agriculture, law) in one bibliography as compared to others. Jasenas attributes these differences to the influence of past bibliographers (e.g., Gesner on Frisius), the importance of the subject as perceived by the bibliographer (e.g. Spach’s inclusion of ethics), and the university curriculum familiar to each bibliographer. Though each attempted a cosmopolitan rendering of the field, his representation fell short of the goal of a neutral and complete representation of the field. These bibliographies should be appreciated, however, if only for their ability to catalogue the growing size of the field: from approximately one-thousand authors (Gesner) to five-thousand authors (Spach) to more than sixty-thousand discrete works (Rand).

Encyclopedic Representations

Perhaps in response to the growing literature in the field, bibliographies gave way to encyclopedias, most notably Macmillan’s Encyclopedia of Philosophy (1967). These collectively authored volumes have attempted to treat individual topics in a general and comprehensive manner. Contrary positions are presented with equal regard—or at least given their day in court for the benefit of novices, scholars of other (sub)disciplines, and experts alike. Rather than advocating for specific views or positions, these entries purport to give accurate, thorough, and undistorted representations of philosophy. But is such an expectation really fulfilled, and, to ask the prior question, is such an expectation even warranted? Decisions about the content of encyclopedias and the exposition of their topics are the choices of lone scholars, who, incidentally, have their own views to defend on the very topics they attempt to present in an unbiased fashion. It is not unreasonable to think that these views compromise the neutrality advertised by encyclopedias of the field.  Moreover, there have been few steps toward transcending the single-author model for encyclopedic entries. Though we should question the assumption that collectives always produce better results than individuals, it is reasonable to suspect that collaboration helps to diminish the distorting effects of individuals’ opinions. Nevertheless, individual authorship and the myth of lone expertise are mainstays, and problems of selection and organization affect encyclopedic representations no less (and perhaps much more) than bibliographic representations.

Visual representations

Though past visual representations of philosophy are scarce, three examples stand out. The first is the work of Milton Hunnex, who created chronological and thematic charts that “take advantage of the fact that philosophical theories tend to recur in the history of thought, and tend to cluster within the limitations of several possibilities of explanation” ([1961] 1983, 1). Hunnex’s book contains twenty-four diagrams, each spread over two full-sized pages, which show various fissions and fusions between ideas and schools of thought over time, depicted on the horizontal axis. Examples of diagrams include “Platonic Dualism,” “Hedonism,” “Kantianism (Dualism), “Analytical Philosophy,” and “Existentialism and Phenomenology.” These diagrams attempt to show both antecedent and consequent influences, and the expected relationships (e.g., Socrates begat Plato, who begat Aristotle) are indeed reflected. Altogether lacking in this work is any discussion of criteria and methodology for drawing the charts, and Hunnex repeatedly affords his contemporaries (now largely forgotten) an equal place with canonical authors. Despite its methodological opacity and weakness, his work can safely be praised for its innovation and utter uniqueness in the field.

The second and third visual examples specifically address the role of people in philosophy. As we saw in discussing narrative representations, this stress on social connection may be especially important for explaining how, in a macroscopic sense, ideas flow across time and space in the field. Collins, who develops this idea more formally using sociological theory, also includes nearly forty diagrams depicting social influence in the field. “Major” and “secondary” or “minor” philosophers are shown in ties of acquaintanceship (including master–pupil ties), as well as conflict based on their work.3 Collins does not include all philosophers, noting in an appendix that “the proportion of publications by and citations to (and hence the influence of) intellectuals falls off rapidly as one leaves the central core [of scholars]. This kind of work would only add to the tails of the distribution” (Collins 1998, 890). As with the bibliometric studies discussed earlier, this observation is based on scientific literature dating back to the modern period, and the validity of these claims for humanities probably deserves further scrutiny. Collins’s representations nevertheless advance a general understanding of social influence in the field, though other questions remain: On what specific bases do attributions of acquaintanceship and conflict rest? How much disagreement is sufficient to characterize one philosopher as “attacking” another (Collins’s term)? Might it be possible for philosophers to agree on some issues yet disagree on others, and how would such a relationship be rendered? These problems arise, in part, from the fact that space is limited and the diagrams are static; only so much can be shown at one time.

A more recent, interactive example is Josh Dever’s Philosophy Family Tree (2005). Visitors to the website (https://webspace.utexas.edu/deverj/personal/philtree/philtree.html) can click through a tree layout or “file browser” display to view a hierarchy of over eight-thousand philosophers since the seventeenth century. While the Tree attracted early attention in the philosophical blogosphere, it records only a single relationship—an “academic parent–child” relationship—across “generations,” and there is neither a consistent methodology for attributing this relationship (sometimes it is one’s dissertation advisor, sometimes a major influence) nor documentation for these attributions. Also, in contrast to Collins’s diagrams, only acquaintanceship is tracked, not disagreements in philosophical views, making it harder to trace the flow of ideas across time. Like the two other visual examples discussed earlier in this section, the Tree should be praised for its sheer existence and ambitions, but greater attention must be paid to methodology before it can have serious research and teaching applications.

Phylo as macroscope

In the foregoing sections, I criticized textual and visual representations of philosophy for their various biases (esp. through their organizational structure) as well as their incompleteness, either in omitting social connections or failing to provide sufficient information about those connections. In this section, I describe the data and interface of Phylo, which attempt to address these weaknesses and provide a representation of the field that is both more neutral and more complete. I also address the limits of representation in general—that is, the distortion that is bound to occur with any representation. In discussing the organization, completeness, and representation-effects of Phylo, it is important to remember that the methodology, rather than the status of its current dataset or interfaces, best captures the macroscopic nature of the tool.

Phylo is built in Drupal, an open-source content management platform, which calls information from one or more SQL databases and offers thousands of add-on modules as well as the ability to design custom modules. Phylo contains several add-ons as well as a suite of custom modules that are planned for release to the public later this year, so that other disciplines may use the same framework for gathering and displaying data. Drupal was chosen for the project both for its flexibility and because its nature as an open-source tool aligns with the principles statement adopted in the mission statement for Phylo (http://phylo.info/mission).

The Phylo database currently contains information about

  • philosophers (e.g., name, date of birth, date of death);
  • faculty positions (e.g., appointments, job openings);
  • institutions (e.g., colleges, universities); and
  • formal scholarly communications (e.g., articles, books, dissertations).

Additional frameworks are being explored for informal scholarly communications (especially correspondence) and teaching materials, such as syllabi. From this data, a number of relations may be constructed, including advisor–advisee ties, dissertation committee service, and departmental colleagues; authorship and citation patterns are also planned. At present, all major datasets on North American philosophers since the 1880s (the date of the first dissertations) have been consulted, and nearly all recorded dissertations and faculty appointments are included, covering over 17,334 philosophers. Data on dissertations was obtained by cross-referencing Dissertation Abstracts International, Thomas Bechtle’s Dissertations in Philosophy Accepted at American Universities, 1861-1975 (1978), and annual lists of doctoral degrees printed in the Review of Metaphysics, as well as archival research at seventeen institutions. Faculty appointment data were obtained by cross-referencing American Philosophical Association membership lists, the biannual Directory of American Philosophers, and departmental records and webpages across various institutions. Information on publications and citations, which is significantly larger, remains an ongoing source of data collection. Data is also collected from user submissions, extending the scalability of the tool and encouraging the development of a community of users who add, explore, and update information. Users are strongly encouraged to provide one or more sources for each item of information (e.g., degree date) they submit, which both increases the transparency of each data point and maintains longstanding practices of citations and scholarly warrants.

Interactive displays have been planned to present this information in various network, chronological, and geographical visualizations. Two sample visualizations are presented in figures 3 and 4, which show a network diagram of individual ties and a timeline of departmental history (respectively).

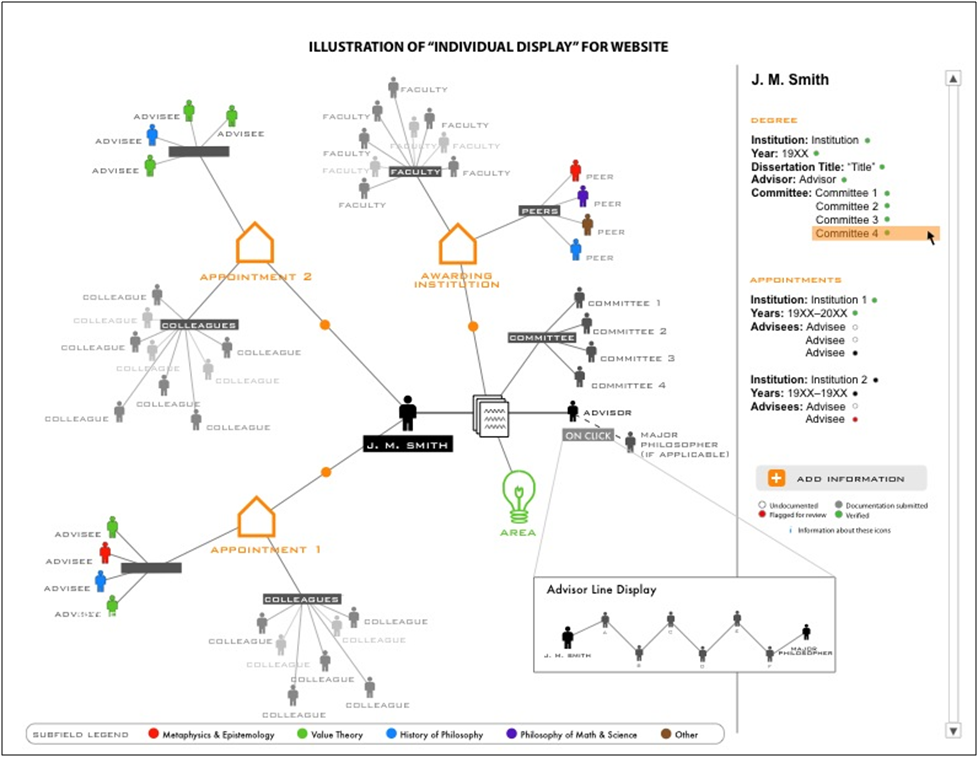
Figure 3 (Click to Enlarge). Sample network graph of individual ties.

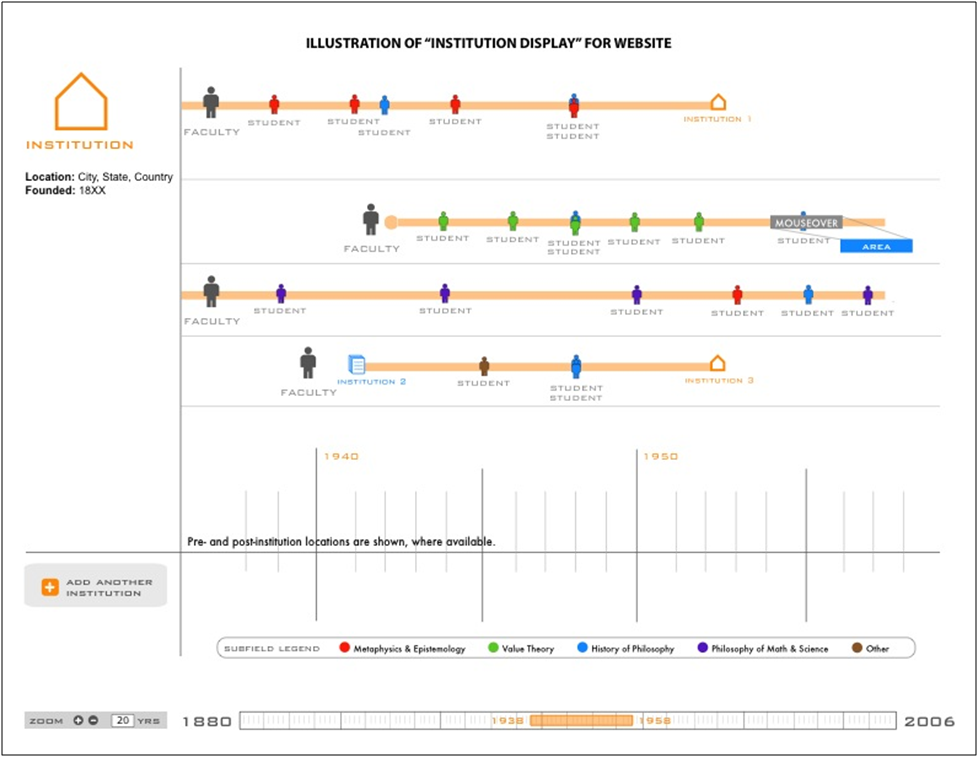
Figure 4 (Click to Enlarge). Sample timeline of a philosophy department.

Each of these visualizations is meant to show, at a glance, the various people and areas associated with one person or a department—providing larger context for that person or department. The timeline display has already been implemented and tested during development, and work on several additional displays with more analytic power is underway in spring 2012.

The digital form of Phylo and its associated computing capabilities afford a unique opportunity for studying the discipline in an empirical way, one that improves upon traditional representations that are at best subjective and at worst merely anecdotal. The usefulness of this method has already been previewed by two recent articles:  Jason Byron (2007) has used bibliometric data to dispel the received view that philosophy of science neglected biology in the 1930s, 1940s, and 1950s. This confirms Moretti’s conclusion that “we see them [quantitative data] falsifying existing theoretical explanations” (30). In a very different use of quantitative methods, Shaun Nichols (2007) has proposed a hypothesis about conjoint belief in separate elements of theory-pairs (e.g., determinists will be more likely than indeterminists to be compatibilists) and tested this by “observing” the views of past philosophers and analyzing pairings of those views for statistical correlations. The novelty of Byron and Nichols’s results, which center on relatively small datasets, suggest even greater potential for Phylo, which is several orders of magnitude larger in size.

The digital nature of Phylo also ensures that hard-and-fast decisions about selection and organization need not be made. So-called “fringe” figures and ideas can be included, along with their connections to other data; if indeed these entities are marginal, then their relative unimportance should be reflected in visualizations of the data. The data framework can also extend to capture new sources of information. While institutional relationships and formal scholarly communications dominated the lives of twentieth-century philosophers, less formal relationships and correspondence were important during earlier periods. The Drupal installation can accommodate such differences by building broader content types with more flexible fields. For example, the content type for documents need not require listing a publisher or exact date; such a framework for documents might be neutral between, say, formal publishing and letters or written notes. In addition, through multiple taxonomies (and crosswalks relating terms in each), documents can be categorized under multiple systems representing subjects and ideas, and users can switch back and forth between different systems of arrangement, eliminating the need for any single, “canonical” organization. These powers of scale and flexibility help to reduce the biases imposed by single authors, editors, or bibliographers that we examined in discussing existing representations. Indeed, comparing different arrangements can itself be a valuable exercise in understanding and even for correcting the biases of each.

One issue that remains, however, is the distorting effect of all representations. For any phenomena with a complexity of n, a representation of n will only be as complex as nm, where m is based on the expressive power of that representation. A 2-D map, for example, will inevitably distort actual geography because of dimension reduction, while a 3-D map may lessen the distortion but is unlikely to completely eliminate it. Similar concerns apply to non-geographic representations, such as those made possible by Phylo. Two points may be offered in response. First, given the empirical basis of Phylo as a project, statistical and event analyses may be performed on the data to yield more accurate, non-representational results, such as the factors that predict the emergence of a major scholar or article. These analyses may, in turn, inform design choices to yield visualizations that reflect statistical realities. Second, as a digital tool, Phylo can represent datasets in a variety of different visualizations; no one type or design need be favored above all others. These various visualizations may then be evaluated, particularly through user studies, to reveal which are most useful, revealing, etc. Though Phylo’s visualizations may exhibit some limitations, Phylo’s digital foundation allows empiricism and pluralism to more thoroughly preclude instances of bias, incompleteness, and distortion.

Once suitable data have been gathered and visualizations created, this framework will help to reveal which kinds of social influence have resulted in interesting and original philosophical ideas and which have led us down more frustrating or less fruitful paths. These observations about the beneficial or detrimental effects of various kinds of social influence would then help to inform practical decisions about admission, employment, tenure and promotion, even research and teaching in the field—all in keeping with de Rosnay’s notion of the macroscope as, above all, a tool for action.

Given the promise of this approach, it is worth asking how empirical evidence can contribute to the design and construction of Phylo, both in terms of data on philosophers and interfaces that would be useful to the philosophical community. The following two sections address the issues of data and display by discussing empirical studies of social connections in philosophy, as well as the role of information visualization in displaying data about the field. Each section presents a pilot study conducted with philosophers about the value they assign to social influences or their experience using visual representations of the field.

Social influence in philosophy

Social connections are often discounted in a field that prizes itself on rationality. As I have argued elsewhere, it is a mistake to regard the progress of philosophical ideas as the march of reason and rationality through time; social influence in the form of teachers, colleagues, and critics plays a central role in practices of reward and reputation, and an empirical study of these influences is sorely needed (Morrow and Sula 2011).

As a preliminary attempt to study this influence, seventy-five philosophers were asked about the information sources that contribute to their understanding of other analytic philosophers. One participant was chosen at random from each of the top fifty Leiter-ranked institutions,4 and one participant was chosen at random from faculty working in the history of analytic philosophy at the top twenty-five Leiter-ranked departments for the study of the history of analytic philosophy. Participants were asked to rank the importance (on a scale of one to six) of various information sources in their understanding of a particular philosophy from the past 125 years. Sources included the individual’s doctoral institution, dissertation advisor, graduate school peers, students he/she advised, and publications. Participants were also asked how much those same things have influenced their own research and/or professional career. The order of the list was changed from the first question to the second, and the wording was shifted from third person (e.g., “dissertation advisor,” “graduate school peers”) to second person (e.g., “who your dissertation advisor was,” “who your peers were in graduate school”). The results of this survey are presented in table 1.

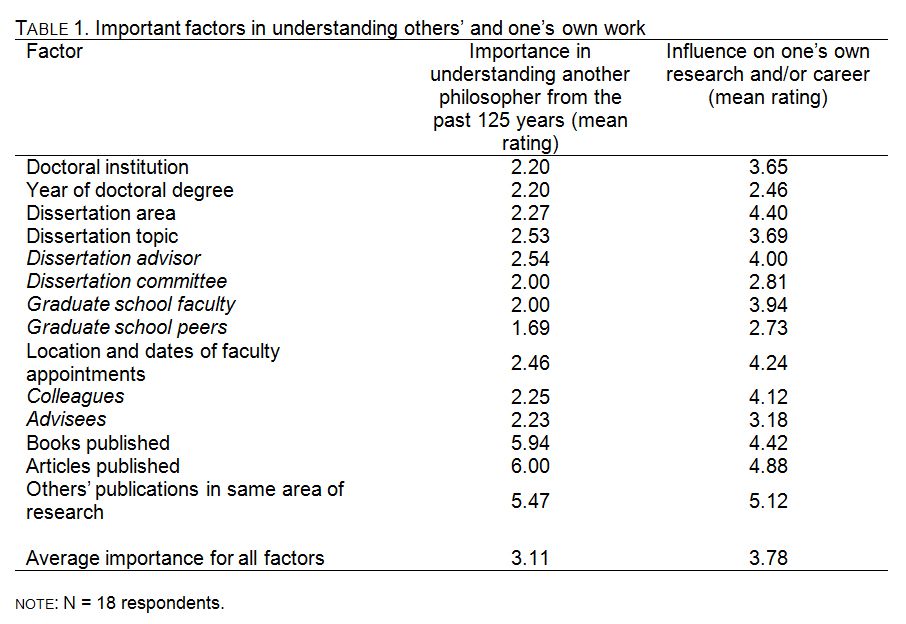
In general, participants rated the influence of most items on their own research/careers as higher than the importance of the same items in understanding the work of others. Even after adjusting for this trend (an average difference of 0.67), participants still ranked personal factors (italicized) with an average importance of 2.12 in others’ work compared to 2.86 (3.53 raw) in their own. The average importance of publications was ranked 5.82 in other’s work and 4.85 (4.18 raw) in their own. The average difference between publications and personal factors was thus 3.70 for others’ work and 1.99 (0.65 raw) for their own. This is a striking asymmetry in perceptions of personal influences: respondents weighted publications nearly twice as important as people in understanding others’ work, yet the difference between the two shrunk by half when respondents were asked about their own influences.

In short, the survey respondents acknowledged that personal ties have an important influence on their own research/careers, yet assign little importance to these ties in understanding other philosophers. The magnitude and mechanisms of personal influences, as well as the cause or causes of this asymmetry in perceived value, are areas for further inquiry. The self-assessment data from the study nevertheless indicates that philosophers recognize the role of social connections in their own work. On the basis of these self-reports, they ought, rationally, to assign the same weight to those connections in approaching the work of others. In incorporating data on social connections as well as publications, Phylo serves an important purpose in facilitating more comprehensive research, and it will be interesting to repeat this survey (or a similar one) with Phylo users in the future to determine if the tool has changed perceptions within the field.

The role of information visualization

While the scale of Phylo offers clear advantages, it also brings with it certain challenges of representation. Chief among them is the need to make high-volume, macroscopic data cognitively salient for users. Much of the information contained in Phylo cannot be easily comprehended in textual form; thus, information visualization, “the use of computer-supported, interactive visual representations of data to amplify cognition,” plays a crucial role (Card, Mackinlay, and Schneiderman 1998). To test the usefulness of different visualization types (and even the usefulness of information visualization itself among philosophers), a pilot study was conducted using data from Phylo as well as publication records contained in PhilPapers, a free online catalog of books, articles, and other publications in philosophy. These experimental visualizations are not included in Phylo at present, and were constructed simply for this study using external software. The methodology of this study as well as the visualizations employed in it are presented below, along with the survey results. I conclude by offering several recommendations for the types of visualizations that could become part of Phylo’s online presence in the future.

Methodology

Four visualizations were prepared for this study based on three different visualization techniques: population graphs, Lexis diagrams, and network diagrams. The methodology and data sources of each chart are described below with the accompanying visualization. Participants were asked to rate (on a five-point scale) how informative each visualization was and how much it reflected their understanding of the topic. They were also asked to provide qualitative feedback on whether they learned anything new from the visualization and how, if at all, their understanding of the topic changed as a result of the visualization. The survey was sent to fifty-five faculty, graduate students, and undergraduate majors in philosophy within the City University of New York. Random selection was not employed in this pilot study, though efforts were made to recruit individuals from a variety of areas and methodologies. Twenty-eight respondents completed at least some part of the survey; nineteen completed all parts. Seventeen provided demographic information on their gender, age, primary status in the field, and primary affiliation. These results are presented in table 2. There was no significant correlation between any demographic categories and participants’ responses. Given the small number of respondents, this is unsurprising, and a larger study would do well to test for such correlations.

Visualization 1: Population graph

Population graphs show the overall structure of a population based on age group (i.e., birth year cohort); male and female figures are often shown separately, since sex has important implications for other demographic trends involving birth rate, education, health, and so on.  Population graphs often highlight the growth and age structure of the population, as well as changes in female and male birth rate and mortality.

For the purpose of this study, the graph was adapted in several ways. Although individuals enter populations through birth or immigration, entry into academic disciplines is usually characterized by completing a doctoral degree in the field. Thus, the year in which a person’s doctoral degree was awarded was used as a proxy for his/her birth year in the field. In this study, there was no correlate for exit because many actual years of death were unknown and, even if they were, it is likely the individuals exit the field through retirement or unemployment in the years or decades before they die. As a result, figure 5 is not a true population graph because it does not show any existent population over a single period of time, but rather several continuous populations within the period indicated. Nevertheless, the chart captures overall trends of growth and decline and gives a sense of the age and gender of the current population.

Figure 5 (Click to Enlarge). Population chart showing North American PhDs in philosophy between 1905 and 2005.

Data on doctoral degrees was compiled from dissertations housed in libraries at seventeen North American institutions, as well as records contained in Dissertation Abstracts International, Thomas Bechtle’s Dissertations in Philosophy Accepted at American Universities, 1861-1975 (1978), and annual lists of doctoral degrees printed in the Review of Metaphysics. Sex was imputed to degree recipients based on first and middle names, as well as additional research about specific individuals. Of the original 14,926 degree recipients, the sex of 911 (6.1 percent) could not be determined, and these were excluded from the visualization.

Visualizations 2 and 3: Lexis diagrams

Lexis diagrams (1875) show the exposure of cohorts to a given condition (e.g., giving birth, contracting a disease) over a continuous period of time. They are useful for looking beyond aggregate population trends to show the contribution of different segments of the population to those trends.

The visualizations below were created with Kirill Andreev’s Lexis Map Viewer, which plots age on one axis and time on another and uses hue to represent density of exposure to the condition of interest: in this case, publishing a journal article. As in the previous visualization, similar adaptations were made to accommodate this special population. In the standard case, cohorts are constructed out of birth years and represent individuals who move through time and historical events together. Academics, however, receive their PhDs at various ages, and a philosopher with n years of experience is more likely comparable to another philosopher with n years of experience, regardless of the age of each, rather than a philosopher of the same age with n + m years of experience. As a result, a better choice than birth year for constructing academic cohorts is the year in which a person’s doctoral degree was awarded. Since year of “death” (i.e., exit from the field) was again unknown, an artificial cutoff of fifty years from receipt of degree was used on the assumption that most individuals receive their degrees, at the earliest, in their late twenties and would likely be retired or dead fifty years from that date.

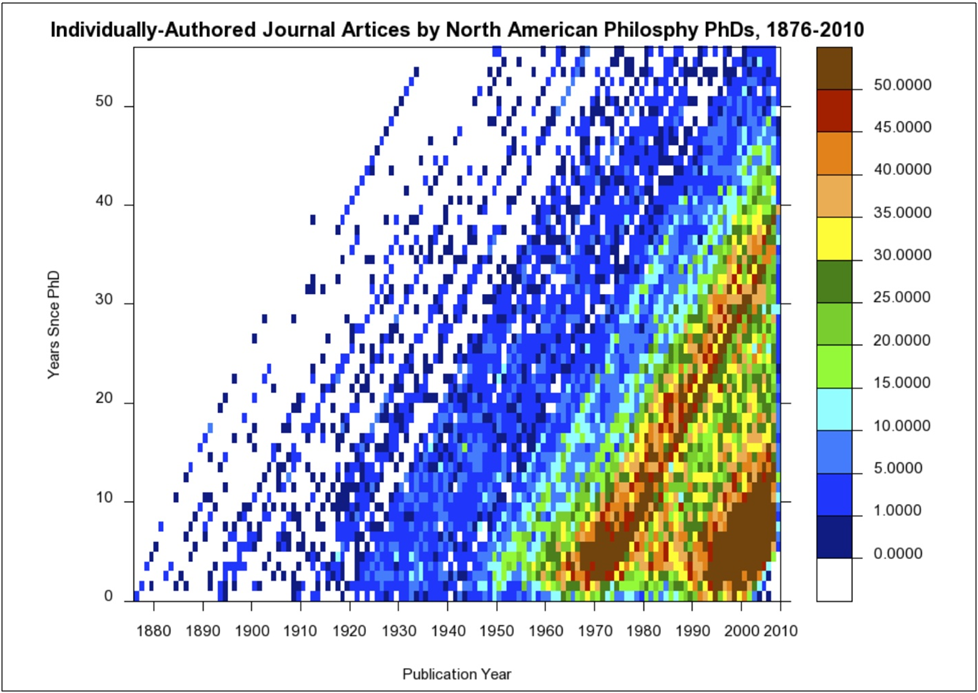
Figure 6 (Click to Enlarge). Lexis diagram showing individually-authored journal articles by North American philosophy PhDs, between 1876 and 2010.

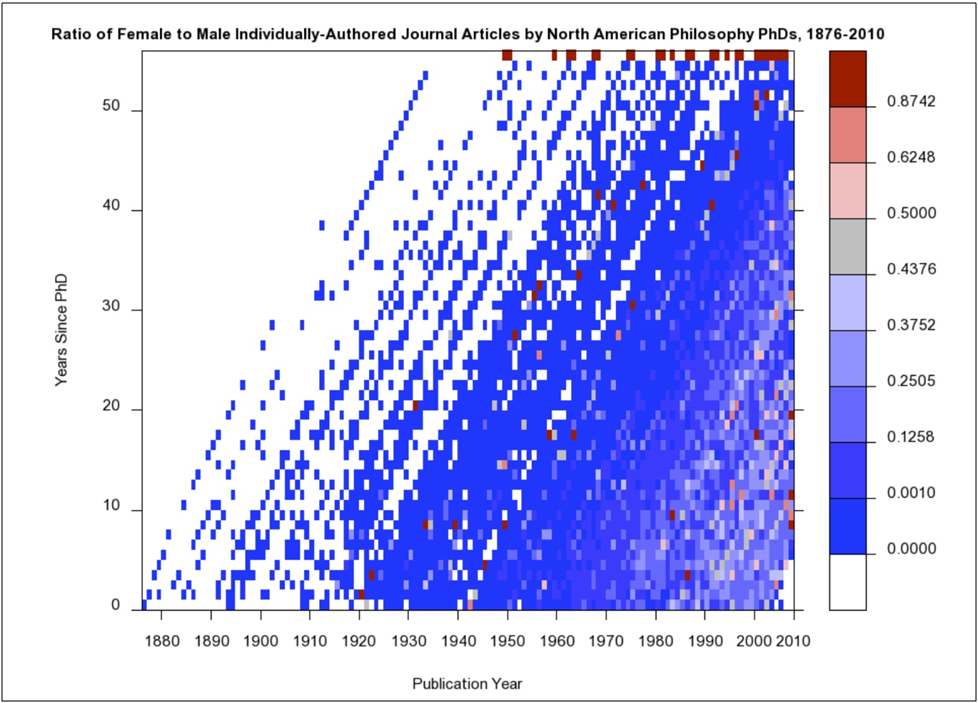
Figure 7 (Click to Enlarge). Lexis diagram showing the ratio of female to male individually authored journal articles by North American philosophy PhDs between 1876 and 2010.

Data for figure 6 was prepared by matching articles listed in PhilPapers with degree and sex information from the first visualization. The number of articles displayed is absolute.5 The ratio of female to male publication in figure 7 was computed by direct comparisons of year x “age” sets (e.g., articles published in 1926 by males who received their degrees eighteen years ago with articles published in 1926 by females who received their degrees eighteen years ago). Of the original 228,078 articles obtained, 56,665 (24.8 percent) were matched with degree data to produce these visualizations. This percentage yield is explained by several factors. First, PhilPapers contains several thousand entries written by psychologists, classicists, and scholars from other disciplines. In addition, 29,799 (13.1 percent) articles were written after 2005. Since the degree dataset ends at 2005, recent publications by junior scholars could not be matched. Finally, North American philosophers account for only a fraction of the overall output of the field. Still, it is reasonable to suspect that the data reflected in these visualizations is far from complete, but there is no reason to suspect any systematic bias that would distort the general accuracy of the visualizations in reflecting overall trends.

Visualization 4: Network diagram

Network diagrams display connections and relationships between parts of a system. Each network is made up of a set of discrete elements (i.e., vertices, nodes, actors) and a set of connections (i.e., edges, links, relational ties) between them (Barabási 2002; Buchanan 2002; Newman, Barabási, and Watts, 2006; Watts 2003). Network analysis can yield information about individual elements, including their prominence and the roles they play as isolates, liaisons, bridges, etc.; pairs of elements, including distance and reachability; and group-level properties, including centralization, density, prestige, and recurring structural patterns (equivalence classes and blockmodels). Current work by network analysts includes the study of multiple relations, dynamic networks, and longitudinal network data.

Data for this visualization was based on Barbara C. Berman’s Library of Congress Subject Headings in Philosophy: A Thesaurus (2001), which provides a hierarchical taxonomy of subject headings. Each subject was treated as a separate node, and the parent–child relationship was recorded as an edge. In some cases, homonyms were disambiguated to aid in clarity.

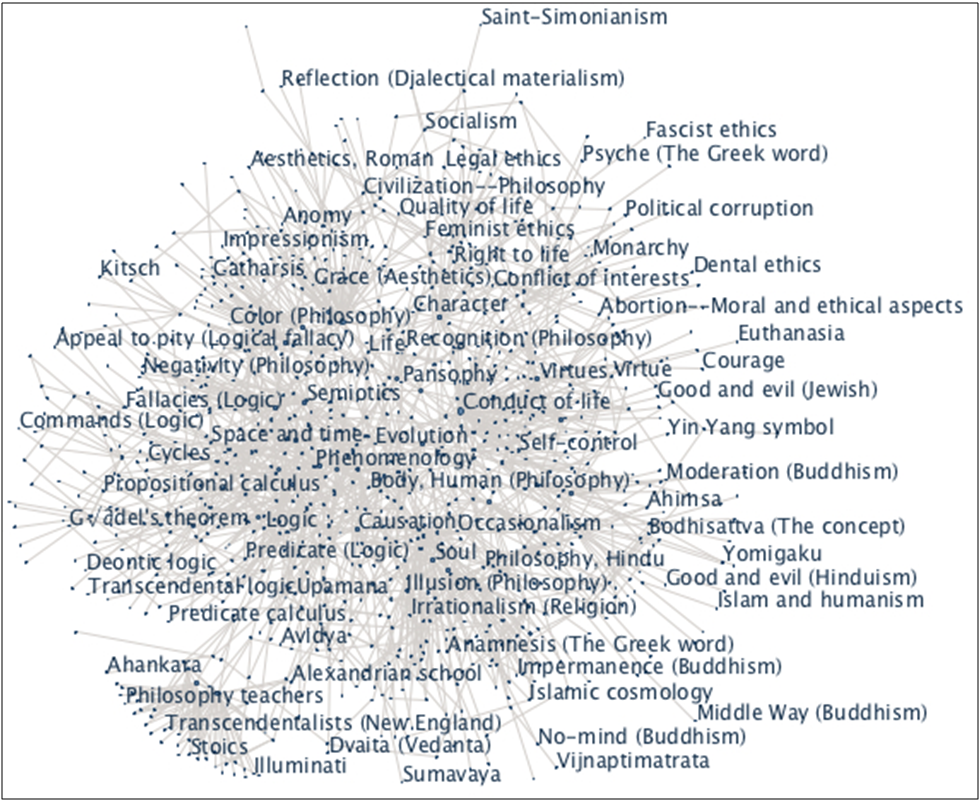
Figure 8 (Click for Interactive Visualization). A network diagram of subject headings in philosophy published by the Library of Congress.

This visualization was prepared using the network display in IBM’s Many Eyes online data visualization software. The software is designed to keep strongly related items close to each other and weakly related ones farther apart. The network display is interactive; it can be zoomed or panned to obtain a detailed view of different parts of the diagram. Clicking on a node highlights its edges and immediately connected nodes.

Results

Participants’ responses about the informativeness of each visualization and how much each visualization reflected their understanding of the topic are shown in figure 9.

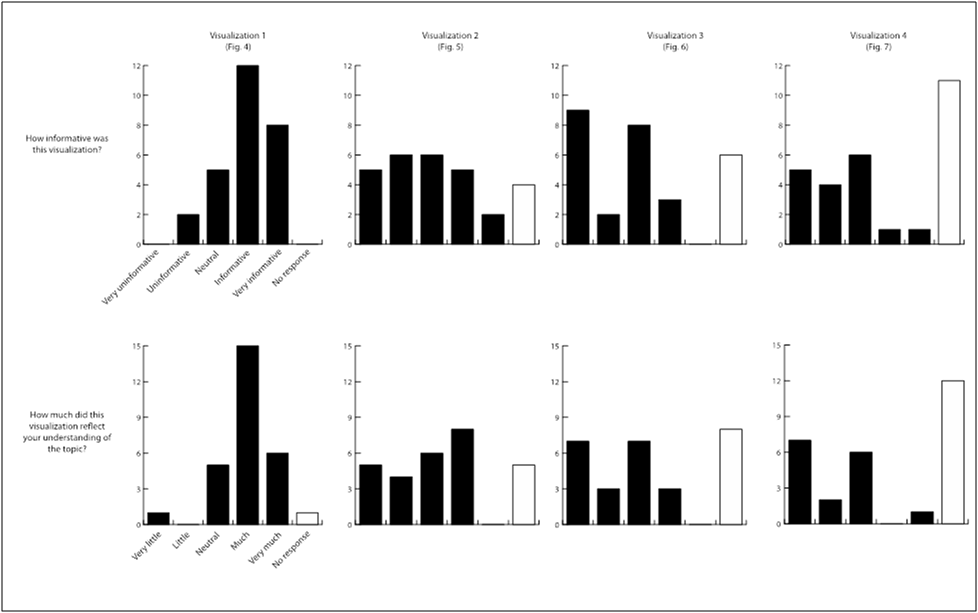
Figure 9 (Click to Enlarge). Results of the information visualization pilot study.

Three-quarters of respondents found the population graph informative or very informative. In their qualitative responses, a number of participants noted the sharp rise in degrees in the 1970s and mid-1990s as well as several trends involving women in the field, including the still-stark gender inequality in the field. Several expressed surprise at the number of women in the field in the early twentieth century while noting that it was still quite small. A few respondents thought that placing the male and female columns side-by-side (as in a traditional column chart) rather than in the population-chart style would have made the visualization clearer.

Data on the Lexis diagrams were inconclusive. Reactions to the first Lexis diagram (see figure 6) included almost equal numbers of favorable and unfavorable responses.  Reactions to the second Lexis diagram (see figure 7) exhibited a bimodal distribution, with many respondents reporting that the visualization was very uninformative or neither informative nor uninformative. One possible explanation of the different reactions to these two Lexis diagrams is that the third visualization relies on more complex ratio data, while the second visualization represents whole numbers of articles. In addition, it is possible that the sequence of the questions influenced responses to the third visualization, with those who had unfavorable reactions to the second visualization exhibiting even more unfavorable reactions to the third (another Lexis diagram).

While the quantitative responses to the Lexis diagrams might recommend discontinuance of their use as visualizations, the qualitative responses tell another story. A number of participants said it took some time to interpret the diagrams, but once they did, the diagrams reflected their understanding of the topic. Those who expressed favorable responses said the diagrams reflected their understanding and made the information more “immediate,” “striking,” and “interesting.” Many respondents, including those who had unfavorable reactions in their quantitative evaluations, began to summarize interesting points of the diagram, offer explanations about trends in the data, or pose further questions about what was happening in the field. These responses suggest that although the visualizations may have been difficult to understand quickly, participants indeed engaged with them, enough to generate critical questions and topics for further inquiry. This reflects Plaisant’s observation that visualization can often be used to “answer questions you didn’t know you had” (2004, 111).

Responses to the network diagram exhibited a bimodal distribution similar to the third visualization, with most participants finding the diagram either very uninformative or neither informative nor uninformative.  A number of respondents noted problems in accessing the diagram, either because of browser incompatibility or errors in JavaScript that prevented them from viewing it. Many thought there was too much information presented initially and some “filtering mechanism” was needed. Several expressed confusion over the network diagram itself, asking about the significance of the nearness relation or questioning the closeness of particular nodes (e.g., police ethics and surrealism.) Despite these difficulties, a few respondents reported that the network diagram was interesting and “pleasant to use,” and one even noted that it “gave me a jolt to realize how much of philosophy is non so-called ‘western’.”

Recommendations

In this study, the four visualizations were presented purposely without explanation or interpretation to test subjects’ unvarnished reactions. In addition, the visualization types were mainly selected from demographic representations, since the information presented concerned populations. Respondents trained primarily in philosophy were probably unfamiliar with these displays and may have needed additional time or training to interpret them. Many seem to have interpreted them correctly, however, and their qualitative responses reflected critical engagement with the visualizations. In future presentations of these visualizations, a short introduction or tutorial explaining the format of the visualization and perhaps drawing attention to one or two points of interest would likely meet with more favorable reactions from participants.

In addition, the network diagram in particular presents challenging issues.  The strength of network diagrams is their ability to display high-density information; at the same time, that sheer volume of data may prove overwhelming and stymie further exploration. As with interactive maps, network visualizations may benefit from pre-set levels of zoom centered around users’ interests. Should they wish, users can then explore other areas or more abstract levels of the diagram without needing to navigate these more complicated layers first. Additional recommendations for simplifying network displays can be found in Herman, Melançon, and Marshall (2000).

Conclusion

As de Rosnay suggested, the macroscope is still in its infancy. Like the microscope, it too will require refinement as an instrument and sufficient practice to yield intelligent use. Still, it is worth reflecting on the timely range of issues in the field that even this pilot study raised: the persistence of gender inequality in North American philosophy, the potential overrepresentation of Western philosophy in perceptions of the field, and underlying structural trends in the population that impact scholarly output. Indeed, the macroscope invites critical inquiries that have been largely excluded from traditional representations of the field—no bibliography gives a subject heading for the gender gap in philosophy, no narrative shows so starkly the full scope of topics contained in the printed record—and affords us valuable opportunities for not only understanding the practices of the field but also for changing them.

For the macroscope to play this role in philosophy and other disciplines, it requires not only use, but intelligent use. It must be focused in the right ways, turned in the proper directions, and supported by a community of inquirers who understand its methods and their applications. The design, data, and visualizations of Phylo all aspire to these standards. Beginning with a researched background of social connections in philosophy, the project incorporates social network analysis, bibliometrics, demography, and other analytical methods to shed new light on ideas and patterns in the field. The design of the interfaces takes advantage of research and user studies in information visualization to provide visitors with a quick, intuitive grasp of high-volume, longitudinal data. Above all, the digital environment of the project provides visitors with opportunities to interact, explore, contribute, and discuss—encouraging the creation of a community around the data, a community that can then shape its own future based on a macroscopic view of itself and its past.

Bibliography

American Philosophical Association. 2003. Philosophy in America at the Turn of the Century. Charlottesville, Virginia: Philosophy Documentation Center. ISBN 9781889680330.

Andreev, Kiril. Lexis Map Viewer, Version 1.0.  [Computer program.] http://www.demogr.mpg.de/books/odense/9/cd/default.htm.

Barabási, Albert-László. 2002. Linked: The new science of networks. Cambridge, Massachusetts: Perseus. ISBN 9780738206677.

Bechtle, Tomas C. 1978. Dissertations in Philosophy Accepted at American Universities, 1861-1975. New York: Garland Publishing. ISBN 9780824098353.

Berman, Barbara L., ed. 2001. Library of Congress Subject Headings in Philosophy: A Thesaurus. Charlottesville, Va.: Philosophy Documentation Center. ISBN 9780912632643.

Boyle, Robert. [1663] 1744. Works. Edited by Thomas Birch. 5 vols. London: A. Millar. OCLC 40814148.

Bracegirdle, Brian. 1978. A History of Microtechnique. Ithaca, New York: Cornell University Press. ISBN 9780801411175.

Buchanan, Mark. 2002. Nexus: Small Worlds and the Groundbreaking Science of Networks. New York: Norton. ISBN 9780393041538.

Byron, Jason M. 2007. “Whence Philosophy of Biology?” British Journal for the Philosophy of Science 58:409–22. ISSN 0007-0882.

Card, Stuart, Jock Mackinlay, and Ben Shneiderman, eds. 1998. Readings in Information Visualization: Using Vision to Think. San Francisco: Morgan Kaufmann. ISBN 9781558605336.

Chalmers, David, and David Bourget, eds. “PhilPapers: Online Research in Philosophy.” Last modified 1 December 2011. http://philpapers.org/.

Collins, Randall. 1998. The Sociology of Philosophies: A Global Theory of Intellectual Change. Cambridge, Massachusetts: Harvard University Press. ISBN 9780674816473.

Cronin, Blaise, Debora Shaw, and Kathryn La Barre. 2003. “A Cast of Thousands: Coauthorship and Subauthorship Collaboration in the 20th Century as Manifested in the Scholarly Journal Literature of Psychology and Philosophy.” Journal of the American Society for Information Science and Technology 54(9):855–71. ISSN 1532-2890. doi:10.1002/asi.10278.

Davidson, Cathy K. 2008. “Humanities 2.0: Promise, Perils, Predictions.” PMLA 123(3):707–17. ISSN 0030-8129.

de Rosnay, Joël. 1979. The Macroscope. New York: Harper & Row. ISBN 9780060110291. http://pespmc1.vub.ac.be/macrbook.html.

Dever, Joshua. The Philosophy Family Tree. University of Texas at Austin, https://webspace.utexas.edu/deverj/personal/philtree/philtree.html (accessed 31 May 2011).

Eakin, Emily. 2004. “Studying Literature By the Numbers.” New York Times. January 10. http://www.nytimes.com/2004/01/10/books/studying-literature-by-the-numbers.html  (accessed 31 May 2011).

Edwards, Paul, ed. 1967. The Encyclopedia of Philosophy. New York: Macmillan. ISBN 9780028949604.

Frisius, Johann Jacob. 1592. Bibliotheca philosophorum classicorum authorum chronologica. In qua veterum philosophorum origo, sucecessio, aetas, & doctrina compendiosa, ab origiine mundi, usq; ad nostram aetatem, proponitur. Tiguri: Apud Ioannem Wolphium, typis Frosch. OCLC 311644457.

Hellqvist, Björn. 2010. “Referencing in the Humanities and its Implications for Citation Analysis.” Journal of the American Society for Information Science and Technology 61(2):310–18. ISSN 1532-2890. doi:10.1002/asi.21256.

Herman, Ivan, Guy Melançon, and M. Scott Marshall. 2000.  “Graph Visualization and Navigation in Information Visualization: A Survey,” in IEEE Transactions in Information Visualization and Computer Graphics 6(1):24–43. doi:10.1109/2945.841119.

Hooke, Robert. 1665. Micrographia; or, Some Physiological Descriptions of Minute Bodies Made by Magnifying Glasses. London: J. Martyn and J. Allestry. OCLC 5390502.

Hunnex, Milton D. [1961] 1983. Chronological and Thematic Charts of Philosophies and Philosophers. Grand Rapids, Michigan: Academie Books. ISBN 9780310462811.

Jasenas, Michael. 1973. A History of the Bibliography of Philosophy. New York: Georg Olms Verlag Hildesheim. ISBN 9783487046662.

Lancho-Barrantes, Bárbara S., Vicente P. Guerrero-Bote, and Félix Moya-Anegón. 2010. “What Lies Behind the Averages and Significance of Citation Indicators in Different Disciplines?” Journal of Information Science 36:371–82. ISSN: 0002-8231.

Leiter, Brian, ed. “The Philosophical Gourmet Report.” Last modified 2009. http://www.philosophicalgourmet.com.

Lexis, Wilhelm. 1875. Einleitung in die Theorie der Bevölkerungsstatistik. Karl Trübner, Straßburg. OCLC 27127671.

Leydesdorff, Loet, Björn Hammarfelt, and Almila Salah. 2011. “The Structure of the Arts & Humanities Citation Index: A Mapping on the Basis of Aggregated Citations Among 1,157 Journals.” Journal of the American Society for Information Science and Technology 62(12):2414–26. ISSN 1532-2890. doi:10.1002/asi.21636.

McLuhan, Marshall. [1964] 1994. Understanding Media: The Extensions of Man. Cambridge, Massachusetts: MIT Press. ISBN 9780262631594.

Moretti, Franco. 2005. Graphs, Maps, Trees: Abstract Models for a Literary History. Brooklyn, New York: Verso. ISBN 9781844670260.

Morrow, David R. and Chris Alen Sula. Phylo. http://phylo.info (accessed 31 May 2011).

———. 2011. “Naturalized Metaphilosophy.” Synthese 182(2):297–313. ISSN 1573-0964. doi:10.1007/s11229-009-9662-1.

Newman, Mark, Albert-Lászlo Barabási, and Duncan J. Watts. 2006. The Structure and Dynamics of Networks. Princeton, New Jersey: Princeton University Press. ISBN 9780691113579.

Nichols, Shaun. 2007. “The Rise of Compatibilism: A Case Study in the Quantitative History of Philosophy.” Midwest Studies in Philosophy 31(1):260–70. ISSN 1475-4975. doi:10.1111/j.1475-4975.2007.00152.x.

Pepe, Alberto. 2011. “The Relationship Between Acquaintanceship and Coauthorship in Scientific Collaboration Networks.” Journal of the American Society for Information Science and Technology 62(11):2121–32. ISSN 1532-2890. doi:10.1002/asi.21629.

Plaisant, Catherine. 2004. “The Challenge of Information Visualization Evaluation” in Proceedings of Conference on Advanced Visual Interfaces AVI’04. IEEE:109–16. ISBN 1-58113-867-9. doi:10.1145/989863.989880.

Rand, Benjamin. [1905] 1965. Bibliography of Philosophy, Psychology, and Cognate Subjects. In Dictionary of Philosophy and Psychology, Vol. III. Edited by James Mark Baldwin. New York: Macmillan.

Singer, Charles. 1970. A Short History of Scientific Ideas to 1900. London: Oxford University Press. ISBN 9780198810490.

Soames, Scott. 2003. Philosophical Analysis in the Twentieth Century. Princeton, New Jersey: Princeton University Press. ISBN 9780691115733.

Stroll, Avrum. 2001. Twentieth-Century Analytic Philosophy. New York: Columbia University Press. ISBN 9780231500401.

Watts, Duncan. J. 2003. Six Degrees: The Science of a Connected Age. New York: Norton. ISBN 9780393041422.

White, Howard, Barry Wellman, and Nancy Nazer. 2004. “Does Citation Reflect Social Structure? Longitudinal Evidence From the “Globenet” Interdisciplinary Research Group.” Journal of the American Society for Information Science and Technology 55(2):111–26. ISSN 1532-2890. doi:10.1002/asi.10369.

Wilson, Catherine. 1995. The Invisible World: Early Modern Philosophy and the Invention of the Microscope. Princeton, New Jersey: Princeton University Press. ISBN 9780691034188.

Zalta, Edward N., ed. Stanford Encyclopedia of Philosophy. http://plato.stanford.edu/ (accessed 31 May 2011).


About the Author

Chris Alen Sula is an Assistant Professor at the School of Information & Library Science at Pratt Institute. He teaches courses in digital humanities, information visualization, knowledge organization, and theory of information. He co-founded Phylo in 2006 with David R. Morrow.


Notes

  1. Acknowledgements: I am greatly indebted to David Morrow for extensive feedback and conversation on the ideas presented here, as well as his work in co-founding and developing Phylo with me over the past six years. I am also grateful to Steve Brier, members of the New Media Lab, the article reviewers, and the journal editors for prompting further clarifications and urging me to reflect more critically on the representational and technical aspects of Phylo.
  2. As Jasenas reports, Varet himself wanted to “determine the constant issues which run through the history of philosophy” to determine the “relevance” of a work—hardly an unbiased decision (1973, 108).
  3. As of January 31, 2012, several of these diagrams are publicly accessible via Google Books. For an example, see <a href=”<a href=”As of January 31, 2012, several of these diagrams are publicly accessible via Google Books. For an example, see http://books.google.com/books?id=2HS1DOZ35EgC&lpg=PA1004&dq=collins%20sociology%20of%20philosophie&pg=PA96#v=onepage&q&f=true” target=”_blank”>http://books.google.com/books?id=2HS1DOZ35EgC&lpg=PA1004&dq=collins%20sociology%20of%20philosophie&pg=PA96#v=onepage&q&f=true”>http://books.google.com/books?id=2HS1DOZ35EgC&lpg=PA1004&dq=collins%20sociology%20of%20philosophie&pg=PA96#v=onepage&q&f=true
  4. Brian Leiter in his “The Philosophical Gourmet Report” “ranks graduate programs primarily on the basis of the quality of faculty.” The latest report (2009) is based on an online survey sent to four hundred-fifty philosophers throughout the English-speaking world in December 2008 and January 2009; about three hundred responded and completed some or all of the surveys.
  5. An alternative visualization was considered in which the total number of articles by cohort c in year y was weighted against the total number of authors, philosophers, or graduates during y, providing a relative sense of scholarship during that year. Doing so, however, would distort the unique contribution of each cohort during that year by expressing the number of its articles in terms of all the cohorts’ published articles. While aggregate measures have their uses, the purpose of Lexis diagrams is to highlight individual cohort contributions, so this alternative version was rejected in favor of figure 7.

Skip to toolbar