Chris Alen Sula, Pratt Institute
Abstract
Macroscopes are tools for viewing what is too large, complex, or dynamic to perceive with the naked eye. This paper examines the use and history of macroscopy in philosophy to represent ideas, trends, and other aspects of the field. Particular emphasis is given to the growing Phylo project, which combines data, user collaboration, and visual analytics to advance the study of philosophy. This paper also presents two pilot studies focused on unique aspects of Phylo: one on the perceived importance of social connections in philosophy and the other on information visualization and academic philosophers. The second study, in particular, points toward several recommendations and areas of further research, and underscores the value of macroscopy in representing the field and suggesting interventions.
Few episodes in the history of technology are as curious as seventeenth-century opinion surrounding the first microscopes. Robert Boyle, an early proponent of microscopy, claimed he could prove his theory of color perception if only he “were sharp-sighted enough, or had such a perfect microscope,” as to discern the surfaces of objects ([1663] 1755 Vol. 5, 680). Robert Hooke announced that, now, “nothing is so small, as to escape our inquiry” (1665, Preface). Enthusiasm for the tool was so complete that the early microscopists were more focused on discussing the design, construction, and performance of their inventions than on making biological observations with them (Bracegirdle 1978, 8). “By 1692,” Catherine Wilson reports, “Hooke was already complaining of reaction against the microscope, of boredom and disenchantment” (1995, 67). Not until the nineteenth century did microscopy inspire a school that carried on the tool—this time with scientific results (Singer 1970, 382).
Nearly three centuries after the microscope was invented, Joël de Rosnay noted the emergence of a new tool: the macroscope. “The macroscope is unlike other tools,” he warned. “It is a symbolic instrument made of a number of methods and techniques borrowed from very different disciplines…It is not used to make things larger or smaller but to observe what is at once too great, too slow, and too complex for our eyes” (de Rosnay 1973, xiv). Within de Rosnay’s sights were topics of energy and survival, information and society, and time and evolution—systems-level phenomena that elude casual perception and exhibit various interaction effects between their constituent elements.
In contrast to the microscope, which was turned on tiny bits of matter, de Rosnay claimed that the macroscope would be focused on ourselves: “This time our glance must be directed towards the systems that surround us in order to better understand them before they destroy us” (xiv). Whereas the microscope was a tool of enhancement and understanding, the macroscope would also be an important tool of action. “Let us use the macroscope,” he urged, “to direct a new look at nature, society, and man to try to identify new rules of education and action” (xiv).
Whether the macroscope(s) will follow the same course as the early microscopes—disuse, disenchantment, delay in adoption—remains to be seen. One suspects its use in fields such as ecology, economics, or evolutionary biology (the principal fields de Rosnay examined) has been enthusiastic and substantive. Whether those in the humanities have embraced the tool is another matter. A telling example may be Franco Moretti’s Graphs, Maps, Trees: Abstract Models for a Literary History (2005). As opposed to the close (microscopic?) readings of a single text that typify literary scholarship, Moretti employs a “distance reading” (macroscopic) method: “instead of concrete, individual works, a trio of artificial constructs—graphs, maps, trees—[is used] in which the reality of the text undergoes a process of deliberate reduction and abstraction….fewer elements, hence a sharper sense of overall interconnection. Shapes, relations, structures. Forms. Models” (1). While Moretti’s work is regarded by many as revolutionary, even he describes it as a “specific form of knowledge,” and Emily Eakin calls Moretti’s approach a “heretical blend of quantitative history, geography, and evolutionary theory” in her review of the book (New York Times, January 10, 2004)—perhaps suggesting that it is not literary or humanistic at all.
This marginalization is a fate for the macroscope that I wish to avoid. In the same pragmatic spirit in which de Rosnay advanced this tool, I suggest that the macroscope affords a wide and unpredictable range of applications across disciplines, including opportunities for understanding the ways in which ideas and knowledge are produced and exchanged, especially in the formal and structured channels of academia. This approach is interdisciplinary, requiring a hefty dose of empirical methodology that is not beyond the scope of criticism. As Cathy Davidson points out, “Data transform theory; theory, stated or assumed, transforms data into interpretation. As any student of Foucault would insist, data collection is really data selection. Which archives should we preserve? Choices based on a complex ideational architecture of canonical, institutional, and personal preferences are constantly being made” (2008, 710). Though critical perspectives on empiricism should not be lost, it is equally misguided to allow them to paralyze knowledge construction, especially where new methods and their applications are concerned. In such cases, it is worth suspending critical concerns provisionally for the sake of further inquiry. An analogy with engineering is helpful here: whatever the epistemic status of a set of scientific facts, those facts may still help build bridges, launch rockets, or cure diseases. In the end, this pragmatic test may be sufficient to justify a place for those facts in what is considered knowledge; if not, at least we are left with rockets, vaccines, and other technologies. So too, the macroscope as a tool may yield interesting and useful results, and epistemological questions may be reserved for a later date, once some results are in.
This paper introduces a macroscopic view of philosophy by discussing Phylo (http://phylo.info), a developing, interactive search tool that will visualize connections and trends between individuals, institutions, and ideas in philosophy. To provide a context for this tool, I begin by surveying past and present attempts to represent philosophy, noting the technologies and media involved in each, as well as their merits and limitations. Following this historical review, I discuss the data and interface for Phylo in greater detail, paying particular attention to two unique aspects of Phylo: its focus on social connections and its use of information visualization. I then present the results of two surveys that separately address each of these aspects. The first survey focuses on social connections in the field and the importance philosophers ascribe to them in their research. The second survey is a pilot study in which philosophers were asked to interact with macroscopic representations of the field and report their experiences. The data from these studies support the overall approach taken with Phylo and suggest several ways in which macroscopic representations might be refined to aid comprehension and facilitate user interaction.
It should be noted that this paper acts as a précis to the macroscopy of philosophy as a whole. In a fuller treatment, it would be necessary to address the modal aspects of philosophy (e.g., philosophers, institutions, schools, ideas) separately by discussing past and possible representations of each in detail, as well as empirical research on various types of visualizations. In this paper, I discuss the field cross-modally, switching liberally between representations of people, places, and ideas in philosophy. My immediate goal here is to demonstrate the power of the macroscopic perspective, and for that purpose, a wide swath of material will suffice.
Representing philosophy
In a macroscopic sense, representations of philosophy present top-level, abstract views of the field, either generally or for some particular subfield of philosophy or topic area. In some cases, they are created to give introductory overviews to orient non-specialists to the history and content of ideas. In others, they are tools for facilitating research or advancing substantive views about the development, merit, and trajectory of particular schools, movements, ideas, and arguments. Representations of philosophy tend toward the textual; few visual examples exist. Still, it is worth surveying the variety of examples and their merits to inform the design of current, macroscopic representations of the field. Since macroscopy will, to some extent, rely on empirical methods and quantitative analysis, it will be helpful to place historical representations within the framework of figure 1, which is based on idealized poles of purely quantitative and purely qualitative representations. This figure also positions three general categories of textual representations (narratives, encyclopedias, bibliographies), as well as the few instances of visual representations, all of which are discussed in greater detail in this section.
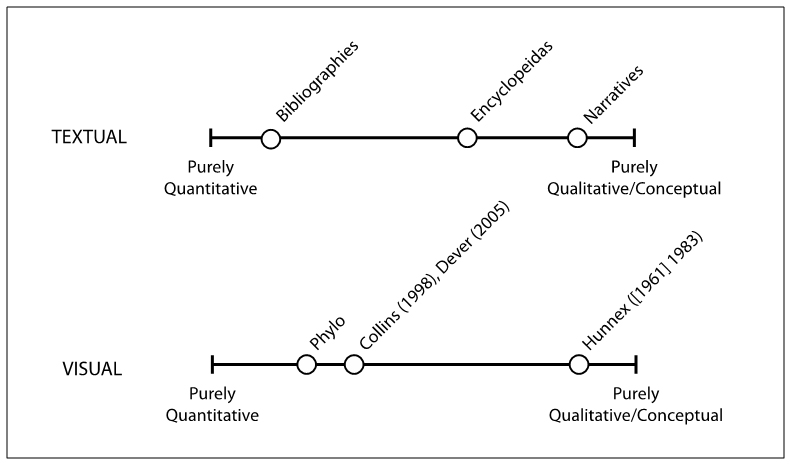
Figure 1. An organizational framework for representations of philosophy.
In assessing these types and representations, it will be helpful to consider issues of neutrality and completeness. Creators of representations are forced to decide not only which material to include and which to exclude (the selection problem), they are also burdened with categorizing that material in particular structures (the organization problem). Both of these processes involve some amount of bias that, to varying degrees, compromises the ideals of neutrality and completeness to which these representations aspire. Of course, it may be equally naïve to suppose that any nonbiased representation of the field is possible. Still, a survey of these representations and their limitations can prove instructive for discovering ways to reduce bias and harness new technologies in the service of more neutral and more complete representations.
Narrative representations
By far, narrative accounts form the most common representations of philosophy and are the stock and trade of most historians of philosophy. In the past decade, significant attention has been given to contemporary analytic philosophy with such notable works as Scott Soames’ two-volume Philosophical Analysis in the Twentieth Century (2003), Avrum Stroll’s Twentieth-Century Analytic Philosophy (2001), and the American Philosophical Association’s Centennial Supplement to the Journal of Philosophical Research, Philosophy in America at the Turn of the Twentieth Century (2003). These and other narratives tend to portray the field in terms of key figures and major movements, leaving aside the minor figures that, in Randall Collins’s view, form the social structure crucial for disseminating ideas: “To speak of . . . a little company of genius would be to misread the sociological point entirely. It is the networks which write the plot of this story, and the structure of network competition over the attention space, which determines creativity, is focused so that the famous ideas become formulated through the mouths and pens of a few individuals” (1998, 78). Collins chooses to represent the field in terms of maps of social connections, which I discuss in a later section on visual representations.
In evaluating narrative accounts and Collins’ criticism, it is worth recalling Marshall McLuhan’s rejection of the notion that content or ideas are simply delivered through the use of various media. On the contrary, “it is the medium that shapes and controls the scale and form of human association and action” (1994, 9). If McLuhan is correct, understanding these delivery methods is at least as important as understanding their actual content, and representing the field strictly in terms of ideas excludes the vehicles by which those ideas are propagated or silenced—the vehicles which also shape and transform those ideas. This fact has long been appreciated by bibliometricians who study patterns of authorship and citation within scholarly book and journal communication. Presently, this research suggests that social connections play an important role in determining co-citation patterns in which two authors cite one another (White, Wellman, and Nazer 2004; Pepe 2011). One must approach these studies with caution, however, because most bibliometric research has been based on scientific literature and citation patterns have been found to differ across disciplines (Lancho-Barrantes, Guerrero-Bote, and Félix Moya-Anegón 2010). Humanists, in particular, are known for crediting each other less frequently than scientists (Hellqvist 2010), but marked patterns of co-citation still exist in the humanities (Leydesdorff 2011) and humanists have begun to credit each other more frequently over time (Cronin, Shaw, and LaBarre 2003). While the full influence of social connections on all citation patterns in the humanities is not fully known, omitting these connections and the minor figures that serve as bridges, liaisons, and transmitters weakens the power of most narrative representations. It is important to note that this weakness is perhaps more the fault of the narrative form itself than that of particular authors; a narrative structure seems ill suited for recording a high volume of connections between people (about whom little else may be known). With this criticism in mind, it is worth reviewing more quantitative textual approaches that may be capable of representing the high-volume data required for macroscopy.
Bibliographic representations
General bibliographies of philosophy date back as early as the fourteenth century, though Johann Jacob Frisius’s 1592 bibliography may be regarded as the pioneer of the form, which was followed for several centuries by larger compendia. As Michael Jasenas notes, these bibliographies all contained some amount of bias: “minor authors whose writings were related to the curriculum of a university often had more chance of being listed in the bibliographies of philosophy of the time than a philosopher whose views were so advanced that they remained for a while peripheral to the field” (1973, 41). The last of these general bibliographies came in 1905 with Benjamin Rand’s massive compilation, which contained over sixty-thousand entries and has been succeeded only by more limited subject bibliographies. While Rand’s bibliography gave exhaustive coverage of the nineteenth century, it still reflected the compiler’s strong interest in psychology, which spans nearly a quarter of the entire work—more than logic, aesthetics, philosophy of religion, and ethics combined. Indeed, Gilbert Varet’s ambitions for an “indiscriminate” catalogue remain unfulfilled to this day.
Beyond problems of inclusion and exclusion, these bibliographies also suffer from various limitations imposed by their printed form. One is the need to aid users in finding sources: Should entries be arranged alphabetically or chronologically? By author/philosopher or subject matter? Should entries be cross-listed (perhaps with a limit on the number of times one source appears)? These questions were most commonly answered with subject classifications such as metaphysics, aesthetics, and ethics. These classifications, however, exhibit biases similar to those involved with inclusion and exclusion of sources. As Jasenas notes: “philosophy has always been in a state of flux, with differing conceptions of scope and interest prevailing at different times. In classical antiquity philosophy encompasses almost all fields of knowledge; but later many of them gradually became separated from philosophy as independent disciplines. Consequently, the history of the subject is largely colored by the continuing tendency to re-define and emphasize special areas of interest formerly included in larger definitions” (12). A variety of historical classifications is presented in figure 2 below.
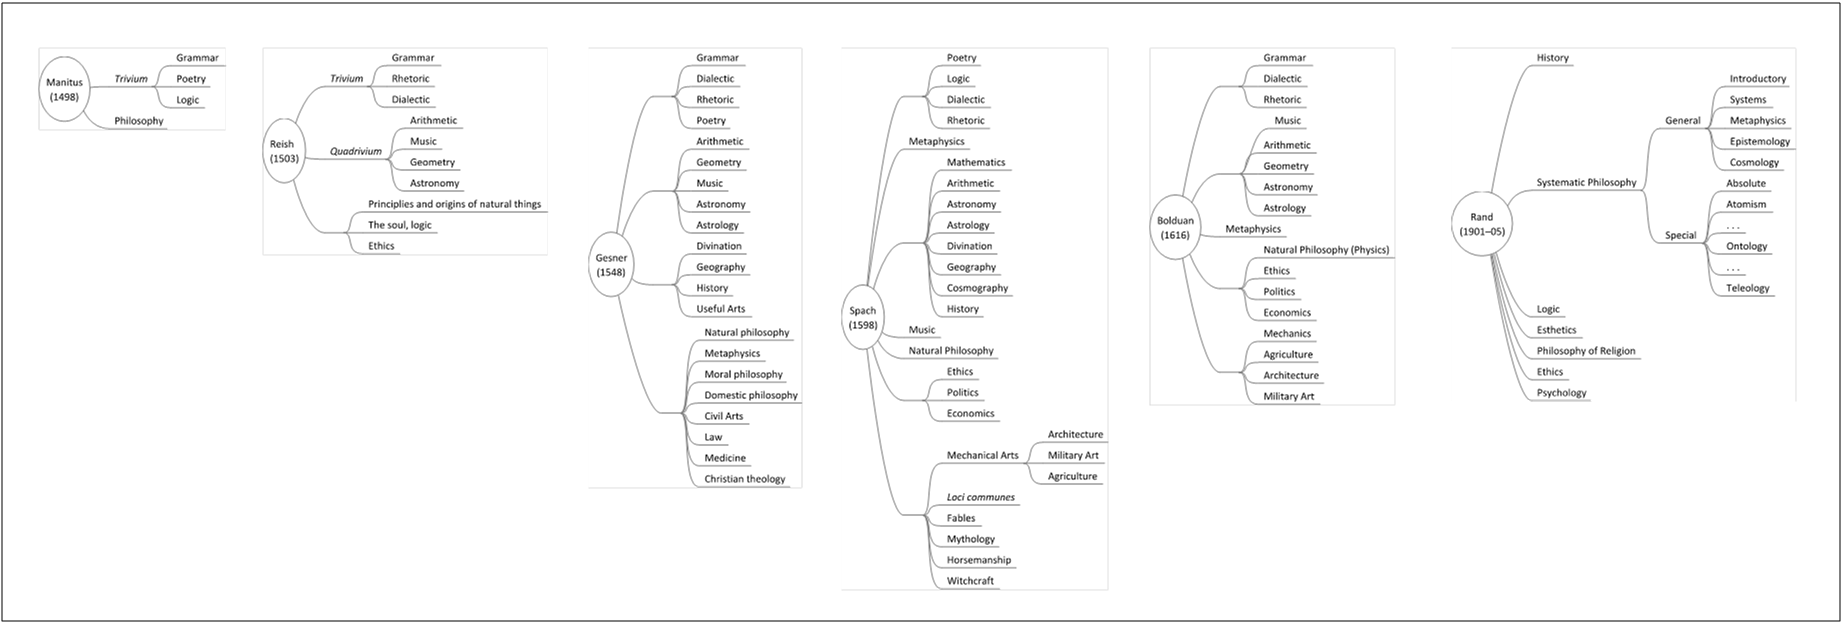
Figure 2 (Click to Enlarge). Comparative diagrams of selected bibliographies of philosophy from 1498 to 1905.
Though there is noticeable overlap between these classifications (e.g., inclusion of the trivium and quadrivium across several centuries), the differences are also telling, both in terms of the position of certain subjects within the author’s taxonomy and the presence or absence of certain subjects (e.g., medicine, agriculture, law) in one bibliography as compared to others. Jasenas attributes these differences to the influence of past bibliographers (e.g., Gesner on Frisius), the importance of the subject as perceived by the bibliographer (e.g. Spach’s inclusion of ethics), and the university curriculum familiar to each bibliographer. Though each attempted a cosmopolitan rendering of the field, his representation fell short of the goal of a neutral and complete representation of the field. These bibliographies should be appreciated, however, if only for their ability to catalogue the growing size of the field: from approximately one-thousand authors (Gesner) to five-thousand authors (Spach) to more than sixty-thousand discrete works (Rand).
Encyclopedic Representations
Perhaps in response to the growing literature in the field, bibliographies gave way to encyclopedias, most notably Macmillan’s Encyclopedia of Philosophy (1967). These collectively authored volumes have attempted to treat individual topics in a general and comprehensive manner. Contrary positions are presented with equal regard—or at least given their day in court for the benefit of novices, scholars of other (sub)disciplines, and experts alike. Rather than advocating for specific views or positions, these entries purport to give accurate, thorough, and undistorted representations of philosophy. But is such an expectation really fulfilled, and, to ask the prior question, is such an expectation even warranted? Decisions about the content of encyclopedias and the exposition of their topics are the choices of lone scholars, who, incidentally, have their own views to defend on the very topics they attempt to present in an unbiased fashion. It is not unreasonable to think that these views compromise the neutrality advertised by encyclopedias of the field. Moreover, there have been few steps toward transcending the single-author model for encyclopedic entries. Though we should question the assumption that collectives always produce better results than individuals, it is reasonable to suspect that collaboration helps to diminish the distorting effects of individuals’ opinions. Nevertheless, individual authorship and the myth of lone expertise are mainstays, and problems of selection and organization affect encyclopedic representations no less (and perhaps much more) than bibliographic representations.
Visual representations
Though past visual representations of philosophy are scarce, three examples stand out. The first is the work of Milton Hunnex, who created chronological and thematic charts that “take advantage of the fact that philosophical theories tend to recur in the history of thought, and tend to cluster within the limitations of several possibilities of explanation” ([1961] 1983, 1). Hunnex’s book contains twenty-four diagrams, each spread over two full-sized pages, which show various fissions and fusions between ideas and schools of thought over time, depicted on the horizontal axis. Examples of diagrams include “Platonic Dualism,” “Hedonism,” “Kantianism (Dualism), “Analytical Philosophy,” and “Existentialism and Phenomenology.” These diagrams attempt to show both antecedent and consequent influences, and the expected relationships (e.g., Socrates begat Plato, who begat Aristotle) are indeed reflected. Altogether lacking in this work is any discussion of criteria and methodology for drawing the charts, and Hunnex repeatedly affords his contemporaries (now largely forgotten) an equal place with canonical authors. Despite its methodological opacity and weakness, his work can safely be praised for its innovation and utter uniqueness in the field.
The second and third visual examples specifically address the role of people in philosophy. As we saw in discussing narrative representations, this stress on social connection may be especially important for explaining how, in a macroscopic sense, ideas flow across time and space in the field. Collins, who develops this idea more formally using sociological theory, also includes nearly forty diagrams depicting social influence in the field. “Major” and “secondary” or “minor” philosophers are shown in ties of acquaintanceship (including master–pupil ties), as well as conflict based on their work. Collins does not include all philosophers, noting in an appendix that “the proportion of publications by and citations to (and hence the influence of) intellectuals falls off rapidly as one leaves the central core [of scholars]. This kind of work would only add to the tails of the distribution” (Collins 1998, 890). As with the bibliometric studies discussed earlier, this observation is based on scientific literature dating back to the modern period, and the validity of these claims for humanities probably deserves further scrutiny. Collins’s representations nevertheless advance a general understanding of social influence in the field, though other questions remain: On what specific bases do attributions of acquaintanceship and conflict rest? How much disagreement is sufficient to characterize one philosopher as “attacking” another (Collins’s term)? Might it be possible for philosophers to agree on some issues yet disagree on others, and how would such a relationship be rendered? These problems arise, in part, from the fact that space is limited and the diagrams are static; only so much can be shown at one time.
A more recent, interactive example is Josh Dever’s Philosophy Family Tree (2005). Visitors to the website (https://webspace.utexas.edu/deverj/personal/philtree/philtree.html) can click through a tree layout or “file browser” display to view a hierarchy of over eight-thousand philosophers since the seventeenth century. While the Tree attracted early attention in the philosophical blogosphere, it records only a single relationship—an “academic parent–child” relationship—across “generations,” and there is neither a consistent methodology for attributing this relationship (sometimes it is one’s dissertation advisor, sometimes a major influence) nor documentation for these attributions. Also, in contrast to Collins’s diagrams, only acquaintanceship is tracked, not disagreements in philosophical views, making it harder to trace the flow of ideas across time. Like the two other visual examples discussed earlier in this section, the Tree should be praised for its sheer existence and ambitions, but greater attention must be paid to methodology before it can have serious research and teaching applications.
Phylo as macroscope
In the foregoing sections, I criticized textual and visual representations of philosophy for their various biases (esp. through their organizational structure) as well as their incompleteness, either in omitting social connections or failing to provide sufficient information about those connections. In this section, I describe the data and interface of Phylo, which attempt to address these weaknesses and provide a representation of the field that is both more neutral and more complete. I also address the limits of representation in general—that is, the distortion that is bound to occur with any representation. In discussing the organization, completeness, and representation-effects of Phylo, it is important to remember that the methodology, rather than the status of its current dataset or interfaces, best captures the macroscopic nature of the tool.
Phylo is built in Drupal, an open-source content management platform, which calls information from one or more SQL databases and offers thousands of add-on modules as well as the ability to design custom modules. Phylo contains several add-ons as well as a suite of custom modules that are planned for release to the public later this year, so that other disciplines may use the same framework for gathering and displaying data. Drupal was chosen for the project both for its flexibility and because its nature as an open-source tool aligns with the principles statement adopted in the mission statement for Phylo (http://phylo.info/mission).
The Phylo database currently contains information about
- philosophers (e.g., name, date of birth, date of death);
- faculty positions (e.g., appointments, job openings);
- institutions (e.g., colleges, universities); and
- formal scholarly communications (e.g., articles, books, dissertations).
Additional frameworks are being explored for informal scholarly communications (especially correspondence) and teaching materials, such as syllabi. From this data, a number of relations may be constructed, including advisor–advisee ties, dissertation committee service, and departmental colleagues; authorship and citation patterns are also planned. At present, all major datasets on North American philosophers since the 1880s (the date of the first dissertations) have been consulted, and nearly all recorded dissertations and faculty appointments are included, covering over 17,334 philosophers. Data on dissertations was obtained by cross-referencing Dissertation Abstracts International, Thomas Bechtle’s Dissertations in Philosophy Accepted at American Universities, 1861-1975 (1978), and annual lists of doctoral degrees printed in the Review of Metaphysics, as well as archival research at seventeen institutions. Faculty appointment data were obtained by cross-referencing American Philosophical Association membership lists, the biannual Directory of American Philosophers, and departmental records and webpages across various institutions. Information on publications and citations, which is significantly larger, remains an ongoing source of data collection. Data is also collected from user submissions, extending the scalability of the tool and encouraging the development of a community of users who add, explore, and update information. Users are strongly encouraged to provide one or more sources for each item of information (e.g., degree date) they submit, which both increases the transparency of each data point and maintains longstanding practices of citations and scholarly warrants.
Interactive displays have been planned to present this information in various network, chronological, and geographical visualizations. Two sample visualizations are presented in figures 3 and 4, which show a network diagram of individual ties and a timeline of departmental history (respectively).
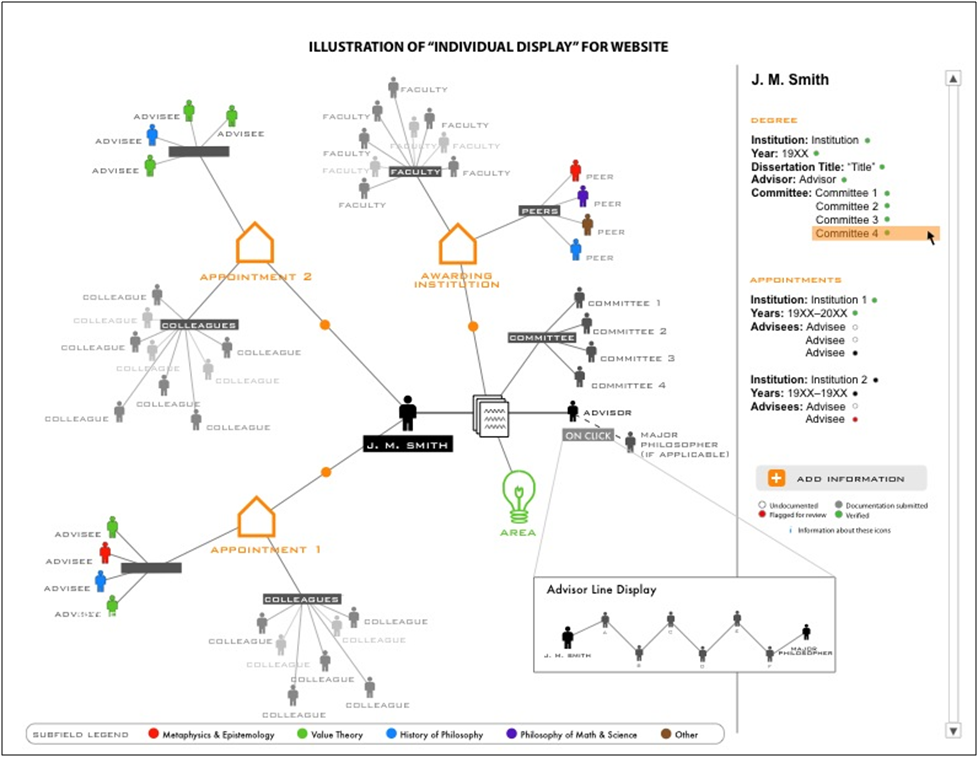
Figure 3 (Click to Enlarge). Sample network graph of individual ties.
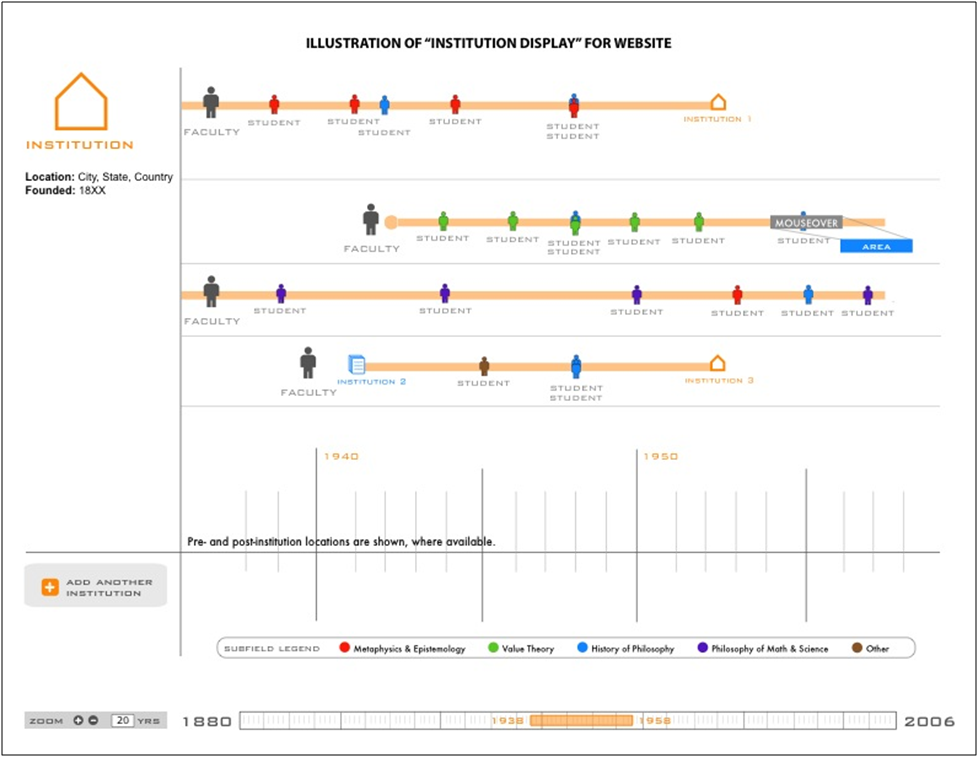
Figure 4 (Click to Enlarge). Sample timeline of a philosophy department.
Each of these visualizations is meant to show, at a glance, the various people and areas associated with one person or a department—providing larger context for that person or department. The timeline display has already been implemented and tested during development, and work on several additional displays with more analytic power is underway in spring 2012.
The digital form of Phylo and its associated computing capabilities afford a unique opportunity for studying the discipline in an empirical way, one that improves upon traditional representations that are at best subjective and at worst merely anecdotal. The usefulness of this method has already been previewed by two recent articles: Jason Byron (2007) has used bibliometric data to dispel the received view that philosophy of science neglected biology in the 1930s, 1940s, and 1950s. This confirms Moretti’s conclusion that “we see them [quantitative data] falsifying existing theoretical explanations” (30). In a very different use of quantitative methods, Shaun Nichols (2007) has proposed a hypothesis about conjoint belief in separate elements of theory-pairs (e.g., determinists will be more likely than indeterminists to be compatibilists) and tested this by “observing” the views of past philosophers and analyzing pairings of those views for statistical correlations. The novelty of Byron and Nichols’s results, which center on relatively small datasets, suggest even greater potential for Phylo, which is several orders of magnitude larger in size.
The digital nature of Phylo also ensures that hard-and-fast decisions about selection and organization need not be made. So-called “fringe” figures and ideas can be included, along with their connections to other data; if indeed these entities are marginal, then their relative unimportance should be reflected in visualizations of the data. The data framework can also extend to capture new sources of information. While institutional relationships and formal scholarly communications dominated the lives of twentieth-century philosophers, less formal relationships and correspondence were important during earlier periods. The Drupal installation can accommodate such differences by building broader content types with more flexible fields. For example, the content type for documents need not require listing a publisher or exact date; such a framework for documents might be neutral between, say, formal publishing and letters or written notes. In addition, through multiple taxonomies (and crosswalks relating terms in each), documents can be categorized under multiple systems representing subjects and ideas, and users can switch back and forth between different systems of arrangement, eliminating the need for any single, “canonical” organization. These powers of scale and flexibility help to reduce the biases imposed by single authors, editors, or bibliographers that we examined in discussing existing representations. Indeed, comparing different arrangements can itself be a valuable exercise in understanding and even for correcting the biases of each.
One issue that remains, however, is the distorting effect of all representations. For any phenomena with a complexity of n, a representation of n will only be as complex as n – m, where m is based on the expressive power of that representation. A 2-D map, for example, will inevitably distort actual geography because of dimension reduction, while a 3-D map may lessen the distortion but is unlikely to completely eliminate it. Similar concerns apply to non-geographic representations, such as those made possible by Phylo. Two points may be offered in response. First, given the empirical basis of Phylo as a project, statistical and event analyses may be performed on the data to yield more accurate, non-representational results, such as the factors that predict the emergence of a major scholar or article. These analyses may, in turn, inform design choices to yield visualizations that reflect statistical realities. Second, as a digital tool, Phylo can represent datasets in a variety of different visualizations; no one type or design need be favored above all others. These various visualizations may then be evaluated, particularly through user studies, to reveal which are most useful, revealing, etc. Though Phylo’s visualizations may exhibit some limitations, Phylo’s digital foundation allows empiricism and pluralism to more thoroughly preclude instances of bias, incompleteness, and distortion.
Once suitable data have been gathered and visualizations created, this framework will help to reveal which kinds of social influence have resulted in interesting and original philosophical ideas and which have led us down more frustrating or less fruitful paths. These observations about the beneficial or detrimental effects of various kinds of social influence would then help to inform practical decisions about admission, employment, tenure and promotion, even research and teaching in the field—all in keeping with de Rosnay’s notion of the macroscope as, above all, a tool for action.
Given the promise of this approach, it is worth asking how empirical evidence can contribute to the design and construction of Phylo, both in terms of data on philosophers and interfaces that would be useful to the philosophical community. The following two sections address the issues of data and display by discussing empirical studies of social connections in philosophy, as well as the role of information visualization in displaying data about the field. Each section presents a pilot study conducted with philosophers about the value they assign to social influences or their experience using visual representations of the field.
Social influence in philosophy
Social connections are often discounted in a field that prizes itself on rationality. As I have argued elsewhere, it is a mistake to regard the progress of philosophical ideas as the march of reason and rationality through time; social influence in the form of teachers, colleagues, and critics plays a central role in practices of reward and reputation, and an empirical study of these influences is sorely needed (Morrow and Sula 2011).
As a preliminary attempt to study this influence, seventy-five philosophers were asked about the information sources that contribute to their understanding of other analytic philosophers. One participant was chosen at random from each of the top fifty Leiter-ranked institutions, and one participant was chosen at random from faculty working in the history of analytic philosophy at the top twenty-five Leiter-ranked departments for the study of the history of analytic philosophy. Participants were asked to rank the importance (on a scale of one to six) of various information sources in their understanding of a particular philosophy from the past 125 years. Sources included the individual’s doctoral institution, dissertation advisor, graduate school peers, students he/she advised, and publications. Participants were also asked how much those same things have influenced their own research and/or professional career. The order of the list was changed from the first question to the second, and the wording was shifted from third person (e.g., “dissertation advisor,” “graduate school peers”) to second person (e.g., “who your dissertation advisor was,” “who your peers were in graduate school”). The results of this survey are presented in table 1.
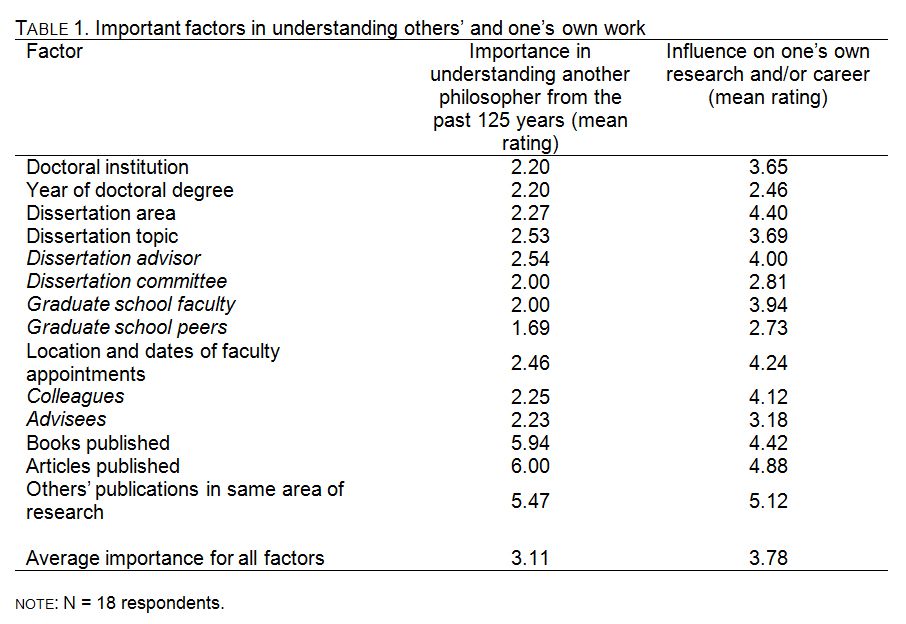
In general, participants rated the influence of most items on their own research/careers as higher than the importance of the same items in understanding the work of others. Even after adjusting for this trend (an average difference of 0.67), participants still ranked personal factors (italicized) with an average importance of 2.12 in others’ work compared to 2.86 (3.53 raw) in their own. The average importance of publications was ranked 5.82 in other’s work and 4.85 (4.18 raw) in their own. The average difference between publications and personal factors was thus 3.70 for others’ work and 1.99 (0.65 raw) for their own. This is a striking asymmetry in perceptions of personal influences: respondents weighted publications nearly twice as important as people in understanding others’ work, yet the difference between the two shrunk by half when respondents were asked about their own influences.
In short, the survey respondents acknowledged that personal ties have an important influence on their own research/careers, yet assign little importance to these ties in understanding other philosophers. The magnitude and mechanisms of personal influences, as well as the cause or causes of this asymmetry in perceived value, are areas for further inquiry. The self-assessment data from the study nevertheless indicates that philosophers recognize the role of social connections in their own work. On the basis of these self-reports, they ought, rationally, to assign the same weight to those connections in approaching the work of others. In incorporating data on social connections as well as publications, Phylo serves an important purpose in facilitating more comprehensive research, and it will be interesting to repeat this survey (or a similar one) with Phylo users in the future to determine if the tool has changed perceptions within the field.
The role of information visualization
While the scale of Phylo offers clear advantages, it also brings with it certain challenges of representation. Chief among them is the need to make high-volume, macroscopic data cognitively salient for users. Much of the information contained in Phylo cannot be easily comprehended in textual form; thus, information visualization, “the use of computer-supported, interactive visual representations of data to amplify cognition,” plays a crucial role (Card, Mackinlay, and Schneiderman 1998). To test the usefulness of different visualization types (and even the usefulness of information visualization itself among philosophers), a pilot study was conducted using data from Phylo as well as publication records contained in PhilPapers, a free online catalog of books, articles, and other publications in philosophy. These experimental visualizations are not included in Phylo at present, and were constructed simply for this study using external software. The methodology of this study as well as the visualizations employed in it are presented below, along with the survey results. I conclude by offering several recommendations for the types of visualizations that could become part of Phylo’s online presence in the future.
Methodology
Four visualizations were prepared for this study based on three different visualization techniques: population graphs, Lexis diagrams, and network diagrams. The methodology and data sources of each chart are described below with the accompanying visualization. Participants were asked to rate (on a five-point scale) how informative each visualization was and how much it reflected their understanding of the topic. They were also asked to provide qualitative feedback on whether they learned anything new from the visualization and how, if at all, their understanding of the topic changed as a result of the visualization. The survey was sent to fifty-five faculty, graduate students, and undergraduate majors in philosophy within the City University of New York. Random selection was not employed in this pilot study, though efforts were made to recruit individuals from a variety of areas and methodologies. Twenty-eight respondents completed at least some part of the survey; nineteen completed all parts. Seventeen provided demographic information on their gender, age, primary status in the field, and primary affiliation. These results are presented in table 2. There was no significant correlation between any demographic categories and participants’ responses. Given the small number of respondents, this is unsurprising, and a larger study would do well to test for such correlations.

Visualization 1: Population graph
Population graphs show the overall structure of a population based on age group (i.e., birth year cohort); male and female figures are often shown separately, since sex has important implications for other demographic trends involving birth rate, education, health, and so on. Population graphs often highlight the growth and age structure of the population, as well as changes in female and male birth rate and mortality.
For the purpose of this study, the graph was adapted in several ways. Although individuals enter populations through birth or immigration, entry into academic disciplines is usually characterized by completing a doctoral degree in the field. Thus, the year in which a person’s doctoral degree was awarded was used as a proxy for his/her birth year in the field. In this study, there was no correlate for exit because many actual years of death were unknown and, even if they were, it is likely the individuals exit the field through retirement or unemployment in the years or decades before they die. As a result, figure 5 is not a true population graph because it does not show any existent population over a single period of time, but rather several continuous populations within the period indicated. Nevertheless, the chart captures overall trends of growth and decline and gives a sense of the age and gender of the current population.

Figure 5 (Click to Enlarge). Population chart showing North American PhDs in philosophy between 1905 and 2005.
Data on doctoral degrees was compiled from dissertations housed in libraries at seventeen North American institutions, as well as records contained in Dissertation Abstracts International, Thomas Bechtle’s Dissertations in Philosophy Accepted at American Universities, 1861-1975 (1978), and annual lists of doctoral degrees printed in the Review of Metaphysics. Sex was imputed to degree recipients based on first and middle names, as well as additional research about specific individuals. Of the original 14,926 degree recipients, the sex of 911 (6.1 percent) could not be determined, and these were excluded from the visualization.
Visualizations 2 and 3: Lexis diagrams
Lexis diagrams (1875) show the exposure of cohorts to a given condition (e.g., giving birth, contracting a disease) over a continuous period of time. They are useful for looking beyond aggregate population trends to show the contribution of different segments of the population to those trends.
The visualizations below were created with Kirill Andreev’s Lexis Map Viewer, which plots age on one axis and time on another and uses hue to represent density of exposure to the condition of interest: in this case, publishing a journal article. As in the previous visualization, similar adaptations were made to accommodate this special population. In the standard case, cohorts are constructed out of birth years and represent individuals who move through time and historical events together. Academics, however, receive their PhDs at various ages, and a philosopher with n years of experience is more likely comparable to another philosopher with n years of experience, regardless of the age of each, rather than a philosopher of the same age with n + m years of experience. As a result, a better choice than birth year for constructing academic cohorts is the year in which a person’s doctoral degree was awarded. Since year of “death” (i.e., exit from the field) was again unknown, an artificial cutoff of fifty years from receipt of degree was used on the assumption that most individuals receive their degrees, at the earliest, in their late twenties and would likely be retired or dead fifty years from that date.
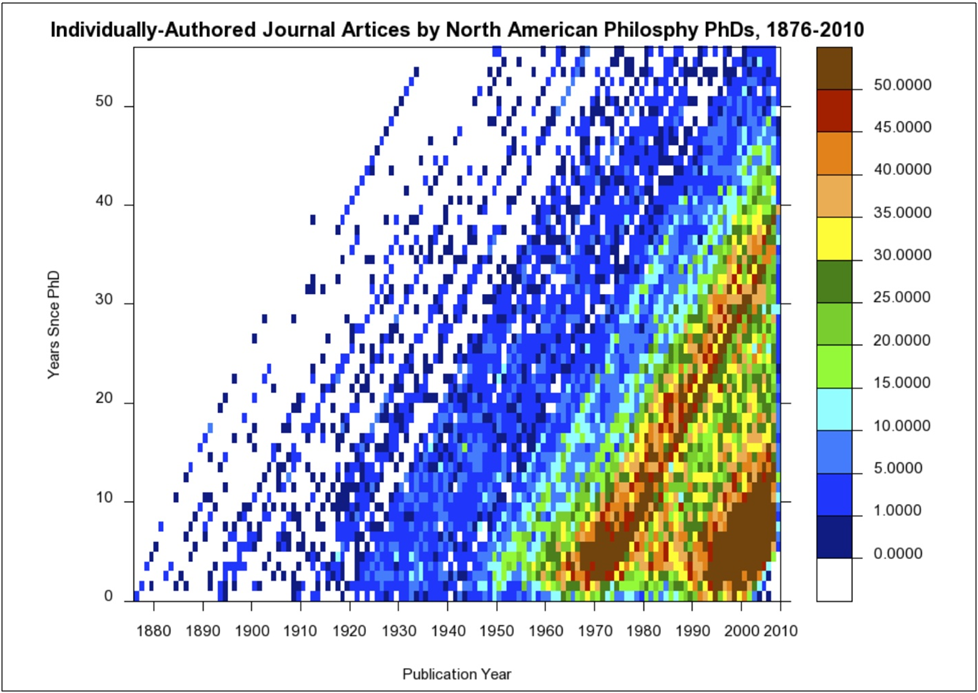
Figure 6 (Click to Enlarge). Lexis diagram showing individually-authored journal articles by North American philosophy PhDs, between 1876 and 2010.
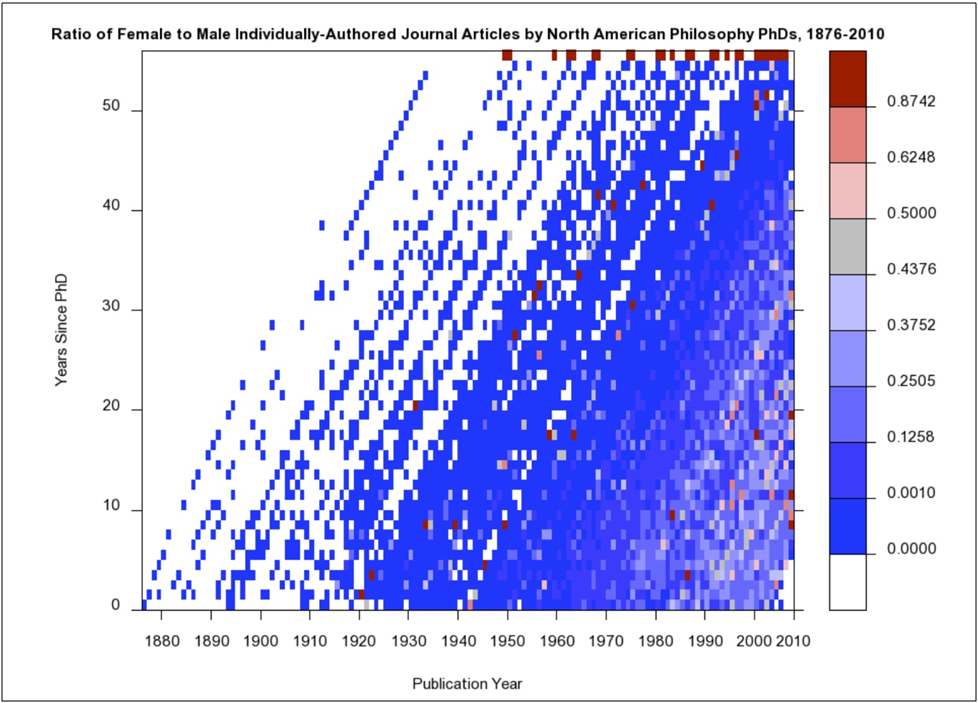
Figure 7 (Click to Enlarge). Lexis diagram showing the ratio of female to male individually authored journal articles by North American philosophy PhDs between 1876 and 2010.
Data for figure 6 was prepared by matching articles listed in PhilPapers with degree and sex information from the first visualization. The number of articles displayed is absolute. The ratio of female to male publication in figure 7 was computed by direct comparisons of year x “age” sets (e.g., articles published in 1926 by males who received their degrees eighteen years ago with articles published in 1926 by females who received their degrees eighteen years ago). Of the original 228,078 articles obtained, 56,665 (24.8 percent) were matched with degree data to produce these visualizations. This percentage yield is explained by several factors. First, PhilPapers contains several thousand entries written by psychologists, classicists, and scholars from other disciplines. In addition, 29,799 (13.1 percent) articles were written after 2005. Since the degree dataset ends at 2005, recent publications by junior scholars could not be matched. Finally, North American philosophers account for only a fraction of the overall output of the field. Still, it is reasonable to suspect that the data reflected in these visualizations is far from complete, but there is no reason to suspect any systematic bias that would distort the general accuracy of the visualizations in reflecting overall trends.
Visualization 4: Network diagram
Network diagrams display connections and relationships between parts of a system. Each network is made up of a set of discrete elements (i.e., vertices, nodes, actors) and a set of connections (i.e., edges, links, relational ties) between them (Barabási 2002; Buchanan 2002; Newman, Barabási, and Watts, 2006; Watts 2003). Network analysis can yield information about individual elements, including their prominence and the roles they play as isolates, liaisons, bridges, etc.; pairs of elements, including distance and reachability; and group-level properties, including centralization, density, prestige, and recurring structural patterns (equivalence classes and blockmodels). Current work by network analysts includes the study of multiple relations, dynamic networks, and longitudinal network data.
Data for this visualization was based on Barbara C. Berman’s Library of Congress Subject Headings in Philosophy: A Thesaurus (2001), which provides a hierarchical taxonomy of subject headings. Each subject was treated as a separate node, and the parent–child relationship was recorded as an edge. In some cases, homonyms were disambiguated to aid in clarity.
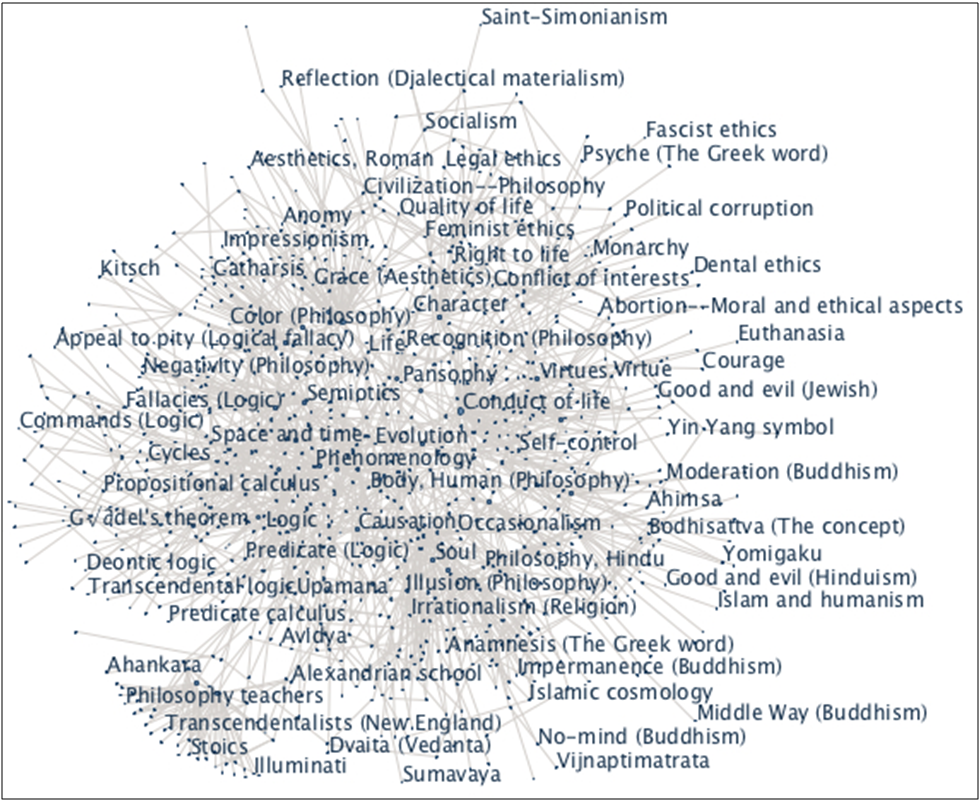
Figure 8 (Click for Interactive Visualization). A network diagram of subject headings in philosophy published by the Library of Congress.
This visualization was prepared using the network display in IBM’s Many Eyes online data visualization software. The software is designed to keep strongly related items close to each other and weakly related ones farther apart. The network display is interactive; it can be zoomed or panned to obtain a detailed view of different parts of the diagram. Clicking on a node highlights its edges and immediately connected nodes.
Results
Participants’ responses about the informativeness of each visualization and how much each visualization reflected their understanding of the topic are shown in figure 9.
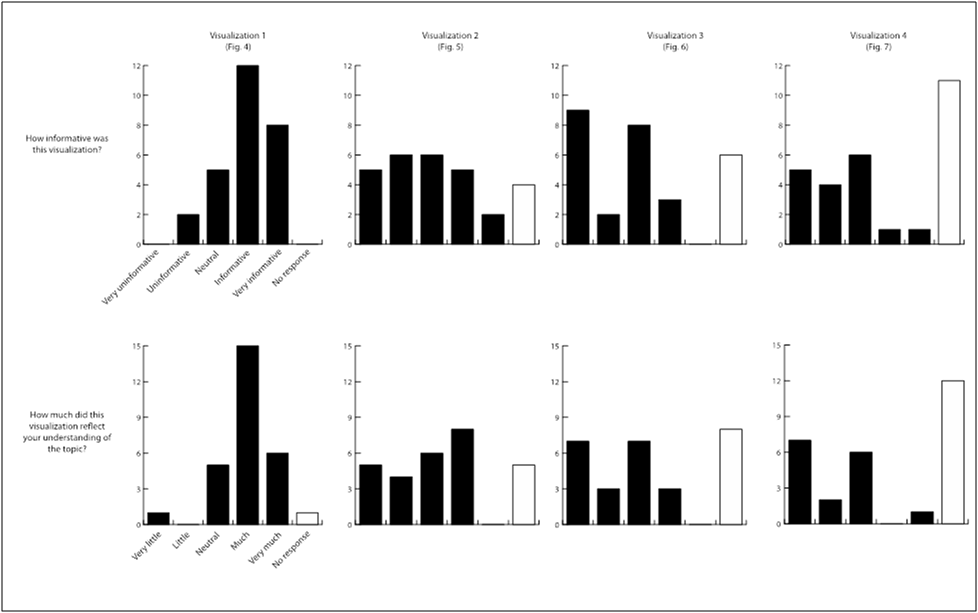
Figure 9 (Click to Enlarge). Results of the information visualization pilot study.
Three-quarters of respondents found the population graph informative or very informative. In their qualitative responses, a number of participants noted the sharp rise in degrees in the 1970s and mid-1990s as well as several trends involving women in the field, including the still-stark gender inequality in the field. Several expressed surprise at the number of women in the field in the early twentieth century while noting that it was still quite small. A few respondents thought that placing the male and female columns side-by-side (as in a traditional column chart) rather than in the population-chart style would have made the visualization clearer.
Data on the Lexis diagrams were inconclusive. Reactions to the first Lexis diagram (see figure 6) included almost equal numbers of favorable and unfavorable responses. Reactions to the second Lexis diagram (see figure 7) exhibited a bimodal distribution, with many respondents reporting that the visualization was very uninformative or neither informative nor uninformative. One possible explanation of the different reactions to these two Lexis diagrams is that the third visualization relies on more complex ratio data, while the second visualization represents whole numbers of articles. In addition, it is possible that the sequence of the questions influenced responses to the third visualization, with those who had unfavorable reactions to the second visualization exhibiting even more unfavorable reactions to the third (another Lexis diagram).
While the quantitative responses to the Lexis diagrams might recommend discontinuance of their use as visualizations, the qualitative responses tell another story. A number of participants said it took some time to interpret the diagrams, but once they did, the diagrams reflected their understanding of the topic. Those who expressed favorable responses said the diagrams reflected their understanding and made the information more “immediate,” “striking,” and “interesting.” Many respondents, including those who had unfavorable reactions in their quantitative evaluations, began to summarize interesting points of the diagram, offer explanations about trends in the data, or pose further questions about what was happening in the field. These responses suggest that although the visualizations may have been difficult to understand quickly, participants indeed engaged with them, enough to generate critical questions and topics for further inquiry. This reflects Plaisant’s observation that visualization can often be used to “answer questions you didn’t know you had” (2004, 111).
Responses to the network diagram exhibited a bimodal distribution similar to the third visualization, with most participants finding the diagram either very uninformative or neither informative nor uninformative. A number of respondents noted problems in accessing the diagram, either because of browser incompatibility or errors in JavaScript that prevented them from viewing it. Many thought there was too much information presented initially and some “filtering mechanism” was needed. Several expressed confusion over the network diagram itself, asking about the significance of the nearness relation or questioning the closeness of particular nodes (e.g., police ethics and surrealism.) Despite these difficulties, a few respondents reported that the network diagram was interesting and “pleasant to use,” and one even noted that it “gave me a jolt to realize how much of philosophy is non so-called ‘western’.”
Recommendations
In this study, the four visualizations were presented purposely without explanation or interpretation to test subjects’ unvarnished reactions. In addition, the visualization types were mainly selected from demographic representations, since the information presented concerned populations. Respondents trained primarily in philosophy were probably unfamiliar with these displays and may have needed additional time or training to interpret them. Many seem to have interpreted them correctly, however, and their qualitative responses reflected critical engagement with the visualizations. In future presentations of these visualizations, a short introduction or tutorial explaining the format of the visualization and perhaps drawing attention to one or two points of interest would likely meet with more favorable reactions from participants.
In addition, the network diagram in particular presents challenging issues. The strength of network diagrams is their ability to display high-density information; at the same time, that sheer volume of data may prove overwhelming and stymie further exploration. As with interactive maps, network visualizations may benefit from pre-set levels of zoom centered around users’ interests. Should they wish, users can then explore other areas or more abstract levels of the diagram without needing to navigate these more complicated layers first. Additional recommendations for simplifying network displays can be found in Herman, Melançon, and Marshall (2000).
Conclusion
As de Rosnay suggested, the macroscope is still in its infancy. Like the microscope, it too will require refinement as an instrument and sufficient practice to yield intelligent use. Still, it is worth reflecting on the timely range of issues in the field that even this pilot study raised: the persistence of gender inequality in North American philosophy, the potential overrepresentation of Western philosophy in perceptions of the field, and underlying structural trends in the population that impact scholarly output. Indeed, the macroscope invites critical inquiries that have been largely excluded from traditional representations of the field—no bibliography gives a subject heading for the gender gap in philosophy, no narrative shows so starkly the full scope of topics contained in the printed record—and affords us valuable opportunities for not only understanding the practices of the field but also for changing them.
For the macroscope to play this role in philosophy and other disciplines, it requires not only use, but intelligent use. It must be focused in the right ways, turned in the proper directions, and supported by a community of inquirers who understand its methods and their applications. The design, data, and visualizations of Phylo all aspire to these standards. Beginning with a researched background of social connections in philosophy, the project incorporates social network analysis, bibliometrics, demography, and other analytical methods to shed new light on ideas and patterns in the field. The design of the interfaces takes advantage of research and user studies in information visualization to provide visitors with a quick, intuitive grasp of high-volume, longitudinal data. Above all, the digital environment of the project provides visitors with opportunities to interact, explore, contribute, and discuss—encouraging the creation of a community around the data, a community that can then shape its own future based on a macroscopic view of itself and its past.
Bibliography
American Philosophical Association. 2003. Philosophy in America at the Turn of the Century. Charlottesville, Virginia: Philosophy Documentation Center. ISBN 9781889680330.
Andreev, Kiril. Lexis Map Viewer, Version 1.0. [Computer program.] http://www.demogr.mpg.de/books/odense/9/cd/default.htm.
Barabási, Albert-László. 2002. Linked: The new science of networks. Cambridge, Massachusetts: Perseus. ISBN 9780738206677.
Bechtle, Tomas C. 1978. Dissertations in Philosophy Accepted at American Universities, 1861-1975. New York: Garland Publishing. ISBN 9780824098353.
Berman, Barbara L., ed. 2001. Library of Congress Subject Headings in Philosophy: A Thesaurus. Charlottesville, Va.: Philosophy Documentation Center. ISBN 9780912632643.
Boyle, Robert. [1663] 1744. Works. Edited by Thomas Birch. 5 vols. London: A. Millar. OCLC 40814148.
Bracegirdle, Brian. 1978. A History of Microtechnique. Ithaca, New York: Cornell University Press. ISBN 9780801411175.
Buchanan, Mark. 2002. Nexus: Small Worlds and the Groundbreaking Science of Networks. New York: Norton. ISBN 9780393041538.
Byron, Jason M. 2007. “Whence Philosophy of Biology?” British Journal for the Philosophy of Science 58:409–22. ISSN 0007-0882.
Card, Stuart, Jock Mackinlay, and Ben Shneiderman, eds. 1998. Readings in Information Visualization: Using Vision to Think. San Francisco: Morgan Kaufmann. ISBN 9781558605336.
Chalmers, David, and David Bourget, eds. “PhilPapers: Online Research in Philosophy.” Last modified 1 December 2011. http://philpapers.org/.
Collins, Randall. 1998. The Sociology of Philosophies: A Global Theory of Intellectual Change. Cambridge, Massachusetts: Harvard University Press. ISBN 9780674816473.
Cronin, Blaise, Debora Shaw, and Kathryn La Barre. 2003. “A Cast of Thousands: Coauthorship and Subauthorship Collaboration in the 20th Century as Manifested in the Scholarly Journal Literature of Psychology and Philosophy.” Journal of the American Society for Information Science and Technology 54(9):855–71. ISSN 1532-2890. doi:10.1002/asi.10278.
Davidson, Cathy K. 2008. “Humanities 2.0: Promise, Perils, Predictions.” PMLA 123(3):707–17. ISSN 0030-8129.
de Rosnay, Joël. 1979. The Macroscope. New York: Harper & Row. ISBN 9780060110291. http://pespmc1.vub.ac.be/macrbook.html.
Dever, Joshua. The Philosophy Family Tree. University of Texas at Austin, https://webspace.utexas.edu/deverj/personal/philtree/philtree.html (accessed 31 May 2011).
Eakin, Emily. 2004. “Studying Literature By the Numbers.” New York Times. January 10. http://www.nytimes.com/2004/01/10/books/studying-literature-by-the-numbers.html (accessed 31 May 2011).
Edwards, Paul, ed. 1967. The Encyclopedia of Philosophy. New York: Macmillan. ISBN 9780028949604.
Frisius, Johann Jacob. 1592. Bibliotheca philosophorum classicorum authorum chronologica. In qua veterum philosophorum origo, sucecessio, aetas, & doctrina compendiosa, ab origiine mundi, usq; ad nostram aetatem, proponitur. Tiguri: Apud Ioannem Wolphium, typis Frosch. OCLC 311644457.
Hellqvist, Björn. 2010. “Referencing in the Humanities and its Implications for Citation Analysis.” Journal of the American Society for Information Science and Technology 61(2):310–18. ISSN 1532-2890. doi:10.1002/asi.21256.
Herman, Ivan, Guy Melançon, and M. Scott Marshall. 2000. “Graph Visualization and Navigation in Information Visualization: A Survey,” in IEEE Transactions in Information Visualization and Computer Graphics 6(1):24–43. doi:10.1109/2945.841119.
Hooke, Robert. 1665. Micrographia; or, Some Physiological Descriptions of Minute Bodies Made by Magnifying Glasses. London: J. Martyn and J. Allestry. OCLC 5390502.
Hunnex, Milton D. [1961] 1983. Chronological and Thematic Charts of Philosophies and Philosophers. Grand Rapids, Michigan: Academie Books. ISBN 9780310462811.
Jasenas, Michael. 1973. A History of the Bibliography of Philosophy. New York: Georg Olms Verlag Hildesheim. ISBN 9783487046662.
Lancho-Barrantes, Bárbara S., Vicente P. Guerrero-Bote, and Félix Moya-Anegón. 2010. “What Lies Behind the Averages and Significance of Citation Indicators in Different Disciplines?” Journal of Information Science 36:371–82. ISSN: 0002-8231.
Leiter, Brian, ed. “The Philosophical Gourmet Report.” Last modified 2009. http://www.philosophicalgourmet.com.
Lexis, Wilhelm. 1875. Einleitung in die Theorie der Bevölkerungsstatistik. Karl Trübner, Straßburg. OCLC 27127671.
Leydesdorff, Loet, Björn Hammarfelt, and Almila Salah. 2011. “The Structure of the Arts & Humanities Citation Index: A Mapping on the Basis of Aggregated Citations Among 1,157 Journals.” Journal of the American Society for Information Science and Technology 62(12):2414–26. ISSN 1532-2890. doi:10.1002/asi.21636.
McLuhan, Marshall. [1964] 1994. Understanding Media: The Extensions of Man. Cambridge, Massachusetts: MIT Press. ISBN 9780262631594.
Moretti, Franco. 2005. Graphs, Maps, Trees: Abstract Models for a Literary History. Brooklyn, New York: Verso. ISBN 9781844670260.
Morrow, David R. and Chris Alen Sula. Phylo. http://phylo.info (accessed 31 May 2011).
———. 2011. “Naturalized Metaphilosophy.” Synthese 182(2):297–313. ISSN 1573-0964. doi:10.1007/s11229-009-9662-1.
Newman, Mark, Albert-Lászlo Barabási, and Duncan J. Watts. 2006. The Structure and Dynamics of Networks. Princeton, New Jersey: Princeton University Press. ISBN 9780691113579.
Nichols, Shaun. 2007. “The Rise of Compatibilism: A Case Study in the Quantitative History of Philosophy.” Midwest Studies in Philosophy 31(1):260–70. ISSN 1475-4975. doi:10.1111/j.1475-4975.2007.00152.x.
Pepe, Alberto. 2011. “The Relationship Between Acquaintanceship and Coauthorship in Scientific Collaboration Networks.” Journal of the American Society for Information Science and Technology 62(11):2121–32. ISSN 1532-2890. doi:10.1002/asi.21629.
Plaisant, Catherine. 2004. “The Challenge of Information Visualization Evaluation” in Proceedings of Conference on Advanced Visual Interfaces AVI’04. IEEE:109–16. ISBN 1-58113-867-9. doi:10.1145/989863.989880.
Rand, Benjamin. [1905] 1965. Bibliography of Philosophy, Psychology, and Cognate Subjects. In Dictionary of Philosophy and Psychology, Vol. III. Edited by James Mark Baldwin. New York: Macmillan.
Singer, Charles. 1970. A Short History of Scientific Ideas to 1900. London: Oxford University Press. ISBN 9780198810490.
Soames, Scott. 2003. Philosophical Analysis in the Twentieth Century. Princeton, New Jersey: Princeton University Press. ISBN 9780691115733.
Stroll, Avrum. 2001. Twentieth-Century Analytic Philosophy. New York: Columbia University Press. ISBN 9780231500401.
Watts, Duncan. J. 2003. Six Degrees: The Science of a Connected Age. New York: Norton. ISBN 9780393041422.
White, Howard, Barry Wellman, and Nancy Nazer. 2004. “Does Citation Reflect Social Structure? Longitudinal Evidence From the “Globenet” Interdisciplinary Research Group.” Journal of the American Society for Information Science and Technology 55(2):111–26. ISSN 1532-2890. doi:10.1002/asi.10369.
Wilson, Catherine. 1995. The Invisible World: Early Modern Philosophy and the Invention of the Microscope. Princeton, New Jersey: Princeton University Press. ISBN 9780691034188.
Zalta, Edward N., ed. Stanford Encyclopedia of Philosophy. http://plato.stanford.edu/ (accessed 31 May 2011).
About the Author
Chris Alen Sula is an Assistant Professor at the School of Information & Library Science at Pratt Institute. He teaches courses in digital humanities, information visualization, knowledge organization, and theory of information. He co-founded Phylo in 2006 with David R. Morrow.
Notes


