Articles by Laura Kane


4

Confessions of a Premature Digital Humanist

Abstract

Traditional interpretations of the history of the Digital Humanities (DH) have largely focused on the field’s origins in humanities computing and literary studies. The singular focus on English departments and literary scholars as progenitors of DH obscures what in fact have been the DH field’s multidisciplinary origins. This article analyzes the contributions made by the US social, public, and quantitative history subfields during the 1970s and 1980s to what would ultimately become the Digital Humanities. It uses the author’s long career as a social, quantitative, and public historian (including his early use of mainframe computers in the 1970s to analyze historical data) and his role and experiences as co-founder of CUNY’s pioneering American Social History Project to underscore the ways digital history has provided a complementary pathway to DH’s emergence. The piece also explores the importance of digital pedagogy to DH’s current growth and maturation, emphasizing various DH projects at the CUNY Graduate Center that have helped deepen and extend the impact of digital work in the academy.

“And you may ask yourself—Well… How did I get here?”
Talking Heads, “Once In a Lifetime” (1981)

 
Much actual and virtual ink has been spilled over the past few years recounting how the field of Digital Humanities came into being. As a social historian and someone who has been involved in digital work of one sort or another since the mid 1970s, I am somewhat bemused by what Geoffrey Rockwell has aptly termed the “canonical Roberto Busa story of origin” offered by English department colleagues (Rockwell 2007). That canonical DH history usually starts with the famous Father Roberto Busa developing his digital concordances of St. Thomas Aquinas’s writings beginning in 1949 (the first of which was published in 1974) with critical technical support provided by Thomas Watson, head of IBM.[1] It quickly moves from there to recount the emergence of humanities computing (as it was originally known) in the 1980s, followed by the development of various digitized literary archives launched by literary scholars such as Jerry McGann (Rossetti) and Ed Folsom (Whitman) in the 1990s (Hockey 2004). In this recounting, academics in English, inspired by Father Busa, pushed ahead with the idea of using computers to conceive, create, and present the digital concordances, literary editions, and, ultimately, fully digitized and online archives of materials, using common standards embodied in the Text Encoding Initiative (TEI), which was established in 1987.[2] The new field of Digital Humanities is said to have emerged after 2004 directly out of these developments in the literary studies field, what Willard McCarty terms “literary computing” (McCarty 2011, 4).[3]

As a historian who believes in multi-causal explanations of historical phenomena (including what happens intellectually inside of universities), I think there are alternative interpretations of this origin story that help reveal a much more complicated history of DH.[4] I will argue in this piece that the history field—particularly historians working in its social, public, and quantitative history sub-fields—also made a substantial and quite different contribution to the emergence of the Digital Humanities that parallels, at times diverges from, and even anticipates the efforts of literary scholars and literary studies.[5] I will first sketch broader developments in the social, public, and quantitative history sub-fields that began more than four decades ago. These transformations in the forms and content of historical inquiry would ultimately lead a group of historians to contribute to the development of DH decades later. I will also use my own evolution over this time period (what I dub in the title of this piece my “premature” Digital Humanism), first as a social and labor historian, then as a media producer, digital historian, and finally now as a teacher of digital humanities and digital pedagogy, to illustrate the different pathways that led many historians, myself included, into contributing to the birth and evolution of the Digital Humanities. I will use my ongoing collaborations with my colleagues at the American Social History Project (which I co-founded more than 35 years ago) as well as with Roy Rosenzweig and the Center for History and New Media to help tell this alternate DH origins story. In the process, I hope to complicate the rather linear Father Busa/humanities computing/TEI/digital literary archives origin story of DH that has come to define the field.

Social and Labor History

Social history first emerged in the pre-World War II era with the founding in 1929 in France of the Annales school of historical inquiry by Lucien Febvre and Marc Bloch and carried forward by Fernand Braudel in the 1950s and Emmanuel Le Roy Ladurie in the 1970s. The field of social history found fertile new ground in the United States during the 1960s and 1970s. The “new” social history was very much a product of the rejection of traditional political history narratives and a search for new methodologies and interdisciplinary connections. Social history examined the lives and experiences of “ordinary people”—workers, immigrants, enslaved African Americans, women, urban dwellers, farmers, etc.—rather than the narrow focus on the experiences of Great White Men that had dominated both academic and popular history writing for decades if not centuries. This changed historical focus on history “from the bottom up” necessitated the development of new methodological approaches to uncover previously unused source materials that historians needed to employ to convey a fuller sense of what happened in the past. Archives and libraries had traditionally provided historians access to large collections of private and public correspondence of major politicians, important military leaders, and big businessmen (the gendered term being entirely appropriate in this context) as well as catalogued and well-archived state papers, government documents, and memoirs and letters of the rich and famous. But if the subject of history was now to change to a focus on ordinary people, how were historians to recount the stories of those who left behind few if any traditional written records? New methodologies would have to be developed to ferret out those hidden histories.[6]

The related sub-field of labor history, which, like social history, was also committed to writing history “from the bottom up,” illustrates these methodological dilemmas and possibilities. Older approaches to US labor history had focused narrowly on the structure and function of national labor unions and national political parties, national labor and party leaders, and what happened in various workplaces, drawing on government reports, national newspapers, and union records. The new labor history, which was pioneered in the early 1960s, first by British Marxist historians such as Eric Hobsbawm and E. P. Thompson, sought to move beyond those restricted confines to tell the previously unknown story of the making of the English working class (to appropriate the title of one of Thompson’s most important works). Hobsbawm and especially Thompson relied heavily in their early work on unconventional local and literary sources to uncover this lost history of English working people. The new labor history they pioneered was soon adapted by US labor historians, including David Montgomery, David Brody, and Herbert Gutman and by graduate students, deploying an array of political and cultural sources to reveal the behaviors and beliefs of US working people in all of their racial and ethnic diversity. The new US labor history embraced unorthodox historical methodologies including: oral history; a close focus on local and community studies, including a deep dive into local working-class newspapers; broadened definitions of what constituted work (e.g. women’s housework); and working-class family and community life and self-activity (including expressions of popular working-class culture and neighborhood, political, and religious associations and organizations). I committed myself to the new labor history and its innovative methodologies in graduate school at UCLA in the early 1970s when I began to shape my doctoral dissertation, which sought to portray the ways black, white, and immigrant coal miners in the West Virginia and Colorado coal fields managed to forge interracial and interethnic local labor unions in the late nineteenth and early twentieth centuries (Brier 1992).

Public History

A second activist and politically engaged approach to communicating historical scholarship—public history—also emerged in the 1970s. Public history grew in parallel to and was made possible by the new academic field of social history. To be sure, while social history spoke largely to the history profession, challenging its underlying methodological and intellectual assumptions, public history and the people who self-identified as public historians often chose to move outside the academy, embedding themselves and their public history work inside unions, community-based organizations, museums, and political groups. Public historians, whether they stayed inside the academy or chose to situate themselves outside of it, were committed to making the study of the past relevant (to appropriate that overused Sixties’ phrase) to individuals and groups that could and would most benefit from exposure to and knowledge about their “lost” pasts (Novick 1988, 512–21).

Public history’s emergence in the mid-1970s signaled that at least one wing of the profession, albeit the younger, more radical one, was committed to finding new ways and new, non-print formats to communicate historical ideas and information to a broad public audience through museum exhibits, graphic novels, audio recordings and radio broadcasts, and especially film and television. A range of projects and institutions that were made possible by this new sub-field of public history began to take shape by the late 1970s. I worked with fellow radical historians Susan Porter Benson and Roy Rosenzweig and the three of us put together in 1986 the first major collection of articles and reports on US public history projects and initiatives. Entitled Presenting the Past, the collection was based on a special theme issue of the Radical History Review (the three of us were members of the RHR editorial collective) that we had co-edited five years earlier.[7] Focusing on a range of individual and local public history projects, Presenting the Past summarized a decade of academic and non-academic public history work and projects in the United States (Benson, Brier, and Rosenzweig 1986).[8]

Stephen Robertson, who now heads the Roy Rosenzweig Center for History and New Media (CHNM)[9] at George Mason University, has correctly noted, in a widely read 2014 blog post,[10] that we can and should trace the origins of the much newer sub-field of digital history, a major contributor to the Digital Humanities’ growth, to the public history movement that was launched a quarter century earlier (Robertson 2014). Robertson goes on to suggest that this early focus on public history led digital historians to ask different questions than literary scholars. Historians focused much more on producing digital history in a variety of presentational forms and formats rather than literary scholars’ emphasis on defining and theorizing the new Digital Humanities field and producing online literary archives. This alternative focus on public presentations of history (i.e., intended for the larger public outside of the academy and the profession) may explain why digital historians seem much less interested in staking out their piece of the DH academic turf while literary scholars seem more inclined both to theorize their DH scholarship and to assert that DH’s genesis can be located in literary scholars’ early digital work.

Quantitative History

A third, and arguably broader, methodological transformation in the study and writing of US history in these same years was the emergence of what was called quantitative history. “Cliometrics” (as some termed it, a bit too cutely) held out the possibility of generating new insights into historical behavior through detailed analyses of a myriad of historical data available in a variety of official sources. This included, but was certainly not limited to, raw data compiled by federal and state agencies in resources like census manuscripts.[11] Quantitative history, which had its roots in the broader turn toward social science taken by a number of US economic historians that began in the late 1950s, had in fact generated by the early 1970s a kind of fever dream among many academic historians and their graduate students (and a raging nightmare for others) (Thomas 2004).[12] Edward Shorter, a historian of psychiatry (!), for example, authored the widely-read The Historian and The Computer: A Practical Guide in 1971. Even the Annales school in France, led by Ladurie, was not immune from the embrace of quantification. Writing in a 1973 essay, Laurie argued that “history that is not quantifiable cannot claim to be scientific” (quoted in Noiret 2012). Quantitative history involved generating raw data from a variety of primary source materials (e.g., US census manuscripts) and then using a variety of statistical tools to analyze that data. The dreams and nightmares that this new methodology generated among academic historians were fueled by the publication of two studies that framed the prominence and ultimate eclipse of quantitative history: Stephan Thernstrom’s Poverty and Progress, published in 1964, and Robert Fogel and Stanley Engerman’s Time on the Cross, which appeared a decade later (Thernstrom 1964; Fogel and Engerman 1974).

Thernstrom’s study used US census manuscripts (the original hand-coded forms for each resident produced by census enumerators) from 1850 to 1880 as well as local bank and tax records and city directories to generate quantitative data, which he then coded and subjected to various statistical measures. Out of this analysis of data he developed his theories of the extent of social mobility, defined occupationally and geographically, that native-born and Irish immigrant residents of Newburyport, Massachusetts enjoyed in those crucial years of the nation’s industrial takeoff. The critical success of Thernstrom’s book helped launch a mini-boom in quantitative history. A three-week seminar on computing in history drew thirty-five historians in 1965 to the University of Michigan; two years later a newsletter on computing in history had more than 800 subscribers (Graham, Milligan, and Weingart 2015). Thernstrom’s early use of quantitative data (which he analyzed without the benefit of computers) and the positive critical reception it received helped launch the quantitative history upsurge that reshaped much US social and urban history writing in the following decade. Without going into much detail here or elaborating on my own deep reservations about Thernstrom’s methodology[13] and the larger political and ideological conclusions he drew from his analysis of the census manuscripts and city directories, suffice it to say that Thernstrom’s work was widely admired by his peers and emulated by many graduate students, helping him secure a coveted position at Harvard in 1973.[14]

The other influential cliometric study, Fogel and Engerman’s Time on the Cross, was widely reviewed (including in Time magazine) after it appeared in early 1974. Though neither author was a social historian (Fogel was an economist, Engerman an economic historian), they were lavishly praised by many academics and reviewers for their innovative statistical analysis of historical data drawn from Southern plantation records (such as the number of whippings meted out by slave owners and overseers to enslaved African Americans). Their use of statistical data led Fogel and Engerman to revise the standard view of the realities of the institution of slavery. Unlike the conclusions reached by earlier historians such as Herbert Aptheker and Kenneth Stampp that centered on the savage exploitation and brutalization of slaves and their active resistance to the institution of slavery, Fogel and Engerman concluded that the institution of slavery was not particularly economically inefficient, as traditional interpretations argued, that the slaves were only “moderately exploited,” and that they were only occasionally abused physically by their owners (Aptheker 1943 [1963]; Stampp 1956 [1967]). Time on the Cross was the focus of much breathless commentary both inside and outside of the academy about the appropriateness of the authors’ assessments of slavery and how quantitative history techniques, which had been around for several decades, would help historians fundamentally rewrite US history.[15] If this latter point sounds eerily prescient of the early hype about DH offered by many of its practitioners and non-academic enthusiasts, I would argue that this is not an accident. The theoretical and methodological orthodoxies of academic disciplines are periodically challenged from within, with new methodologies heralded as life- (or at least field-) changing transformations of the old. Of course, C. Vann Woodward’s highly critical review of Fogel and Engerman in the New York Review of Books and Herbert Gutman’s brilliant book-length takedown of Time on the Cross soon raised important questions and serious reservations about quantitative history’s limitations and its potential for outright distortion (Woodward 1974; Gutman 1975; Thomas 2004). Gutman’s and Woodward’s sharp critiques aside, many academic historians and graduate students (myself included) could not quite resist dabbling in (if not taking a headlong plunge into) quantitative analysis.

Using a Computer to do Quantitative History

Though I had reservations about quantitative history—my skepticism stemming from a general sense that quantitative historians overpromised easy answers to complex questions of historical causation—I decided to broaden the fairly basic new labor history methodology that I was then using in my early dissertation research, which had been based on printed historical sources (government reports, nineteenth-century national newspaper accounts, print archival materials, etc.). I had been drawn to coal miners and coal mining unionism as a subject for my dissertation because of the unusual role that coal miners played historically as prototypical proletarians and labor militants, not only in the United States, but also across the globe. I was interested in understanding the roots of coal miners’ militancy and solidarity in the face of the oppressive living and working conditions they were forced to endure. I also wanted to understand how (or even if) white, black, and immigrant mineworkers had been able to navigate the struggle to forge bonds of solidarity during trade union organizing drives. I had discovered an interesting amount of quantitative data in the course of my doctoral dissertation research: an enumeration of all coal strikes (1,410 in number) that occurred in the United States in the 1881–94 period detailed in the annual reports of the US Commissioner of Labor.[16] This was what we would now call a “dataset,” a term that was not yet used in my wing of the academy in 1975. This critical fourteen-year historical period witnessed the rise and fall of several national labor union organizations among coal miners, including the Knights of Labor, the most consequential nineteenth-century US labor organization, and the birth of the United Mine Workers of America, the union that continues to represent to this day the rapidly dwindling number of US coal miners.

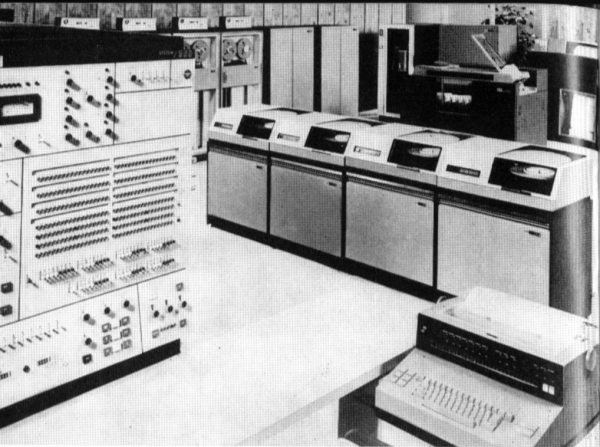
In my collaboration with Jon Amsden, an economic and labor historian and UCLA faculty member, the two of us decided to statistically analyze this data about the behavior and actions of striking coal miners in these years. The dataset of more than 1,400 strikes statistically presented in large tables was simply too large, however, to analyze through conventional qualitative methods to divine patterns and trends. Amsden and I consequently made a decision in 1975 to take the plunge into computer-assisted data analysis. The UCLA Computer Center was a beehive of activity in these early years of academic computing, especially focused on the emerging field of computer science.[17] The center was using an IBM 360 mainframe computer, running Fortran and the Statistical Package for the Social Sciences (the now venerable SPSS, originally released in 1968, and first marketed in 1975) to support social scientific analyses (Noiret 2012).

IBM 360 Computer, circa 1975
Figure 1: IBM 360 Computer, circa 1975

 
Amsden and I began by recording some of the characteristics involved in each of the 1,410 coal strikes that occurred in those 14 years: year of the strike, cause or objective of the strike, and whether a formal union was involved. To make more detailed comparisons we drew a one-in-five systematic random sample of the coal strikes. This additional sampled data included the number of workers involved in each strike, strike duration, and miners’ wages and hours before and after the strike. We laboriously coded each strike by hand on standard 80-character IBM Fortran coding sheets.

IBM Fortran Coding Sheet
Figure 2: IBM Fortran Coding Sheet

 
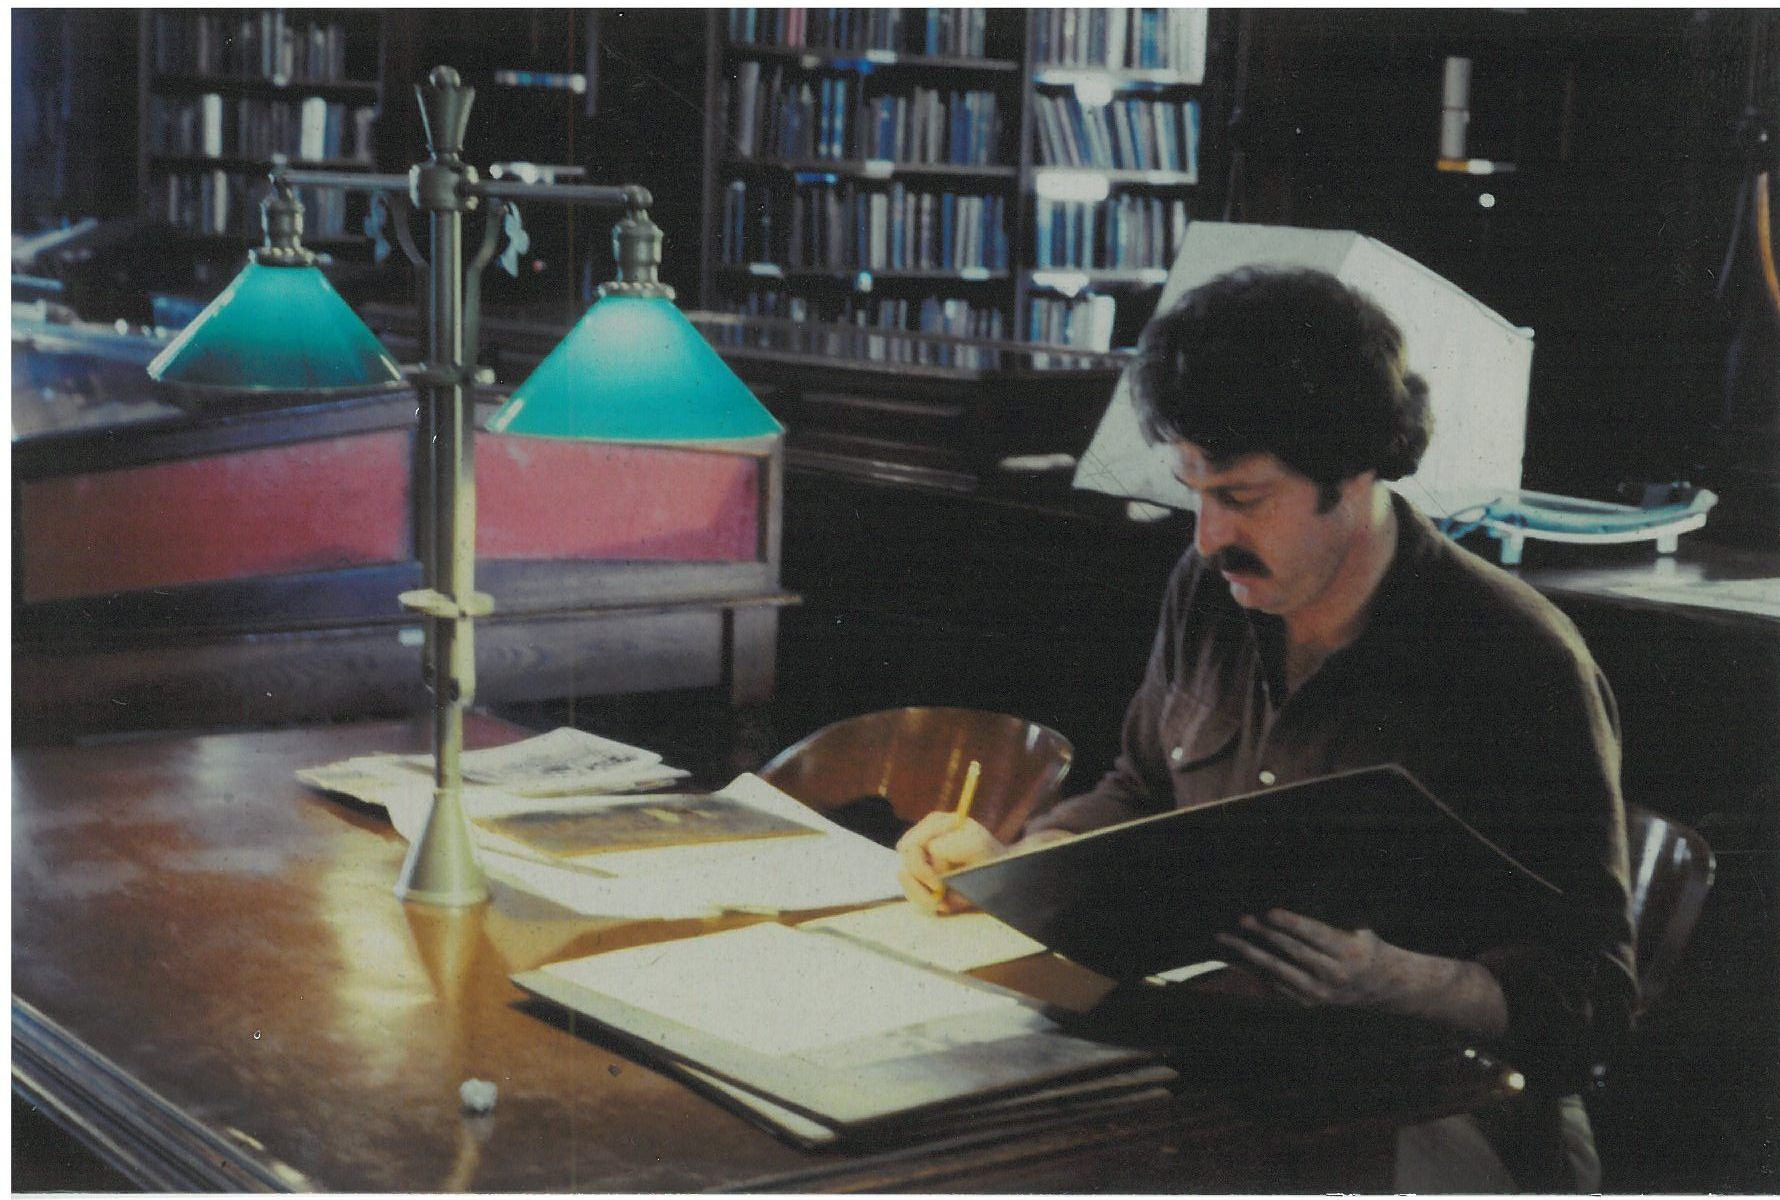
We then had a keypunch operator at the UCLA Computer Center (no doubt a woman, sadly unknown and faceless to us, righteous labor historians though we both were!)[18] transfer the data on each strike entry to individual IBM Fortran punch cards, originally known at Hollerith cards (Lubar 1992). That process generated a card stack large enough to carry around in a flat cardboard box the size of a large shoe box.

Fortran Punch Card
Figure 3: Fortran Punch Card

 
We regularly visited the UCLA Computer Center in the afternoon to have our card stack “read” by an IBM card reading machine and then asked the IBM 360 to generate specific statistical tabulations and correlations we requested, trying to uncover trends and comparative relationships among the data.[19] The nature of this work on the mainframe computer did not require us to learn Fortran (I know DHer Steve Ramsay would disapprove![20]), though Amsden and I did have to brush up on our basic statistics to be able to figure out how to analyze and make sense of the computer output. We picked up our results (the “read outs”) the next morning, printed on large, continuous sheets of fanfold paper.

IBM 360 Fanfold Paper
Figure 4: IBM 360 Fanfold Paper

 
It was a slow and laborious process, with many false starts and badly declared and pointless computing requests (e.g., poor choices of different data points to try to correlate).

Ultimately, however, this computerized data analysis of strike data yielded significant statistical correlations that helped us uncover previously unknown and only partially visible patterns and meanings in coal miners’ self-activity and allowed us to generate new insights (or confirm existing ones) into the changing levels of class consciousness exhibited by miners. Our historical approach to quantitative analysis was an early anticipation, if I can be permitted a bit of hyperbole, of Franco Moretti’s “distant reading” techniques in literary scholarship (Moretti 2005), using statistical methods to examine all strikes in an industry, rather than relying on a very “close reading” of one, two, or a handful of important strikes that most labor historians, myself included, typically undertook in our scholarly work. Amsden and I wrote up our results in 1975 and our scholarly article appeared in the Journal of Interdisciplinary History in 1977, a relatively new journal that featured interdisciplinary and data-driven scholarship. The article received respectful notice as a solid quantitative contribution to the field and was reprinted several times over the next three decades (Amsden and Brier 1977).[21]

One of our key statistical findings was that the power and militancy of coal miners increased as their union organizations strengthened (no surprises there) and that heightened union power between 1881 and 1894 (a particularly contentious period in US labor history) generated more militant strikes in the coal industry. Our data analysis revealed that these militant strikes often moved away from narrow efforts to secure higher wages to allow miners across the country to pose more fundamental challenges to the coal operators’ near total control over productive relations inside coal pits. Below are two screen shots, both generated by SPSS, from the published article: a scatter diagram (a new technique for historians to employ, at least in 1975) and one of the tables. The two figures convey the kinds of interesting historical questions we were able to pose quantitatively and how we were able to represent the answers to those questions graphically.

Scatter Diagram of Multi-establishment US Coal Strikes, 1881 to 1894
Figure 5: Scatter Diagram of Multi-establishment US Coal Strikes, 1881 to 1894

 
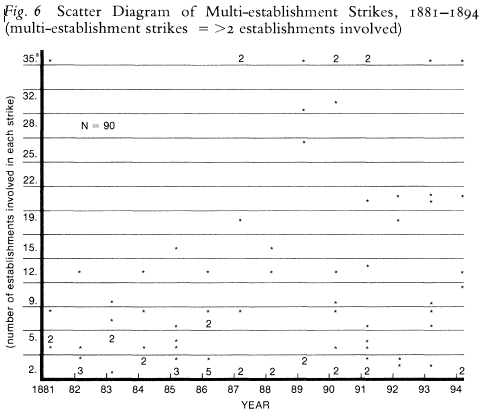
Figure 5 above shows the growth in the number of multi-establishment coal strikes and the increasing number of mines involved in strike activity over time, a good measure of increasing union power and worker solidarity over the critical 14-year period covered in the dataset.

Table 3: Index of Strike Solidarity, comparing Union-Called Coal Strikes with Non-Union Strikes

 
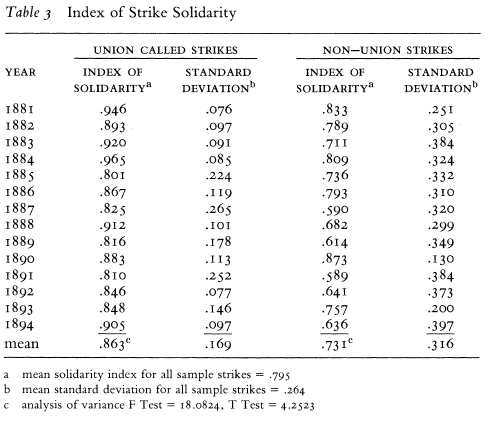
Table 3 employs a solidarity index that Amsden and I developed out of our analysis of the coal strike statistics, based on the ratio of the number of strikers to the total number of mine employees in a given mine whose workers had gone out on strike. The data revealed that union-called strikes were consistently able to involve a higher percentage of the overall mining workforce as compared to non-union strikes and with less variation from the norm. This table lay at the heart of why I had decided to study coal miners and their unions in the first place. I hoped to analyze why and how miners consistently put themselves and their unions at the center of militant working-class struggles in industrializing America. I might have reached some of these same conclusions by analyzing traditional qualitative sources or by looking closely at one or a handful of strikes. However, Amsden and I had managed to successfully employ a statistical analysis in new ways (at least in the history field) that allowed us to “see” these developments and trends in the data nationally and regionally. We were able therefore to argue that the evolving consciousness of miners over time was reflected in their strike demands and in their ability to successfully spread the union message across the country. I should note here that the United Mine Workers of America had become the largest union by far in these early years of the American Federation of Labor. In sum, we believed we had developed a new statistical methodology to analyze and understand late nineteenth-century working-class behavior. We had used a computer to help answer conceptual questions that were important in shaping our historical interpretation. This effort proved to be a quite early instance of the use of digital techniques to ask and at least partially answer key historical (and, by definition, humanities) questions.

From Quantitative History to the American Social History Project

Around the time of the 1977 publication of the coal miners on strike article I decided to follow my public history muse, morphing from a university-based history scholar and professor-in-training, albeit one who had begun to use new digital technologies, into an activist public historian. I had moved to New York City soon after completing the computer-aided project on coal mining strikes to learn how to produce history films. This was a conscious personal and career choice I made to leave the academy to become an independent filmmaker. My commitment to historical ideas having a greater public and political impact drove my decision to change careers. On my first job in New York in 1977 as research director for a public television series of dramatic films on major moments in US labor history I met Herbert Gutman, one of the deans of the new labor and social history whose work I had read and admired as a graduate student. I spent the next two years researching and producing historical documentaries and other kinds of dramatic films.

The author in 1980 doing research for an educational television project on NYC history at the Columbia Univ. library. (Picture credit: Julie List)
Figure 7: The author in 1980 doing research for an educational television project on NYC history at the Columbia Univ. library. (Picture credit: Julie List)

 
Two years after meeting Gutman I was invited by Herb, who taught at the CUNY Graduate Center, to co-teach a summer seminar for labor leaders for which he had secured funding from the National Endowment for the Humanities (NEH). The NEH summer seminars, in an innovative combination of academic and public history, were designed to communicate to unionized workers the fruits of the new social and labor history that Herb had done so much to pioneer and to which I had committed my nascent academic career in graduate school at UCLA. With the success of these summer seminars, which we taught at the CUNY Graduate Center in 1979 and 1980, Gutman and I decided to create the American Social History Project (ASHP) at CUNY. We reasoned that reaching 15 workers each summer in our seminars, though immensely rewarding for all involved (including the two teachers), was not as efficient as creating a new curriculum that we could make available to adult and worker education programs and teachers across the country. The project quickly received major grants in 1981 and 1982, totaling $1.2 million, from the NEH and the Ford Foundation, and under Herb’s and my leadership we rapidly hired a staff of a dozen historians, teachers, artists, and administrators to create a multimedia curriculum, entitled “Who Built America?” (WBA?). The curriculum mixed the writing of a new two-volume trade book focused on working people’s contributions to US history with a range of new multimedia productions (initially 16mm films and slide/tape shows, VHS videos and, later, a range of digital productions, including two Who Built America? CD-ROMs and several web sites such as “History Matters”). ASHP also had a second, clear orientation, in addition to developing multimedia materials: We built a vibrant education program that connected the project in its first few years with CUNY community college faculty and also New York City high school teachers who used our media materials (including specially designed accompanying viewer guides) in their classes that helped deepen and refine Who Built America?’s pedagogical impact on students. We hoped this multimedia curriculum and ASHP’s ongoing engagement with teachers would broaden the scope and popular appeal of working-class and social history and would be widely adopted in high school, community college, and worker education classrooms around the country as well as by the general public.[22]

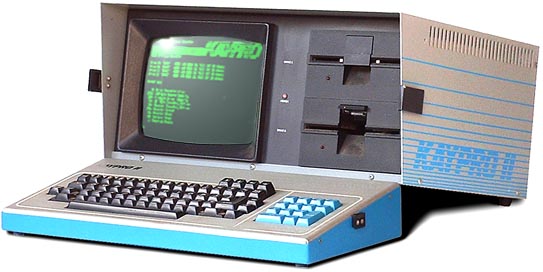
I should note here that my early exposure to electronic tools, including being a “ham” radio operator and electronics tinkerer in high school in the early 1960s and using mainframe computers at UCLA in 1975, inclined me to become an early and enthusiastic adopter of and proselytizer for personal computers when they became publicly available in the early 1980s. I insisted in 1982, for example, against resistance from some of my ASHP colleagues who expected to have secretarial help in writing and editing their WBA? chapter drafts, that we use personal computers (I was Kaypro II guy!) to facilitate the drafting and editing of the Who Built America? textbook, work on which began that year (ASHP 1990, 1992).[23]

Kaypro II Computer
Figure 8: Kaypro II Computer

 
ASHP stood outside of the academic history profession as traditionally understood and practiced in universities at that time. As a grant-funded, university-based project with a dozen staff members, many of us with ABDs in history who worked on the project full-time (not on traditional nine-month academic schedules), ASHP staff were clearly “alt-ac”ers several decades before anyone coined that term. We wore our non-traditional academic identities proudly and even a bit defiantly. Gutman and I also realized, nonetheless, that ASHP needed a direct link to an academic institution like CUNY to legitimize and to establish an institutional base that would allow the project to survive and thrive, which led us to instantiate ASHP inside of CUNY. The American Social History Project, in fact, celebrated its 35th anniversary in CUNY in October 2016.[24] That was a consequential decision, obviously, since ASHP might not have survived without the kind of institutional and bureaucratic support that CUNY (and the Graduate Center) have provided over the past three and a half decades. ASHP, at the same time, also stood outside of the academic history profession in believing in and in producing our work collaboratively, which militated against the “lone scholar in the archive” cult that still dominates most academic scholarship and continues to fundamentally determine the processes of promotion and tenure inside the academy. Public history, which many ASHP staff members came out of, had argued for and even privileged such collaborative work, which in a very real sense is a precursor to the more collaborative work and projects that now define much of the new digital scholarship in the Digital Humanities and in the “alt-ac” careers that have proliferated in its wake. Well before Lisa Spiro (2012) enumerated her list of key DH “values”—openness, collegiality and connectedness, diversity, and experimentation—we had embodied those very values in how we structured and operated the American Social History Project (and continue to do so), a set of values that I have also tried to incorporate and teach in all of my academic work ever since.

ASHP’s engagement with collaborative digital work began quite early. In 1990 we launched a series of co-ventures with social historian Roy Rosenzweig (who had been a valued and important ASHP collaborator from the outset of the project a decade earlier, including as a co-author of the Who Built America? textbook) and Bob Stein, the head of The Voyager Company, the pioneering digital publisher. Roy and I had begun in the late 1980s to ruminate about the possibilities of computer-enhanced historical presentations when Bob Stein approached me in 1990 with a proposal to turn the first volume of the WBA? trade book (which had just been published) into an electronic book (ASHP 1990).[25] Applying the best lessons Roy and I and our ASHP colleagues had learned as public historians who were committed to using visual, video, audio, and textual tools and resources to convey important moments and struggles in US history, we worked with Voyager staff to conceive, design, and produce the first Who Built America? CD-ROM in 1993, covering the years 1876 to 1914 (ASHP 1993).[26] As noted earlier, our use of multimedia forms was an essential attribute that we learned as practitioners of public history, a quite different orientation than that relied on by literary DHers who work with text analysis.

The disk, which was co-authored by Roy Rosenzweig, Josh Brown, and me, was arguably the first electronic history book and one of the first e-books ever to appear. The WBA? CD-ROM won critical popular acclaim and a number of prestigious awards, inside in the academy and beyond (Thomas 2004). It also generated, perhaps because of its success, a degree of political notoriety when its inclusion by Apple in the tens of thousands of educational packs of CD-ROMs the company gave away to K-12 schools that purchased Apple computers in 1994-95 led to a coordinated attack on WBA?, ASHP, and Apple by the Christian Right and the Moral Majority. The Radical Right was troubled by the notion conveyed in several of the literally hundreds of primary historical documents we included in the CD-ROM that “gay cowboys” might have been involved in the “taming” of the West or that abortion was common in early twentieth-century urban America. The right-wing attacks were reported in the mainstream press, including the Wall Street Journal and Newsweek.

Putting the ‘PC’ in PCs,” Newsweek, February 20, 1995
Figure 9: “Putting the ‘PC’ in PCs,” Newsweek, February 20, 1995

 
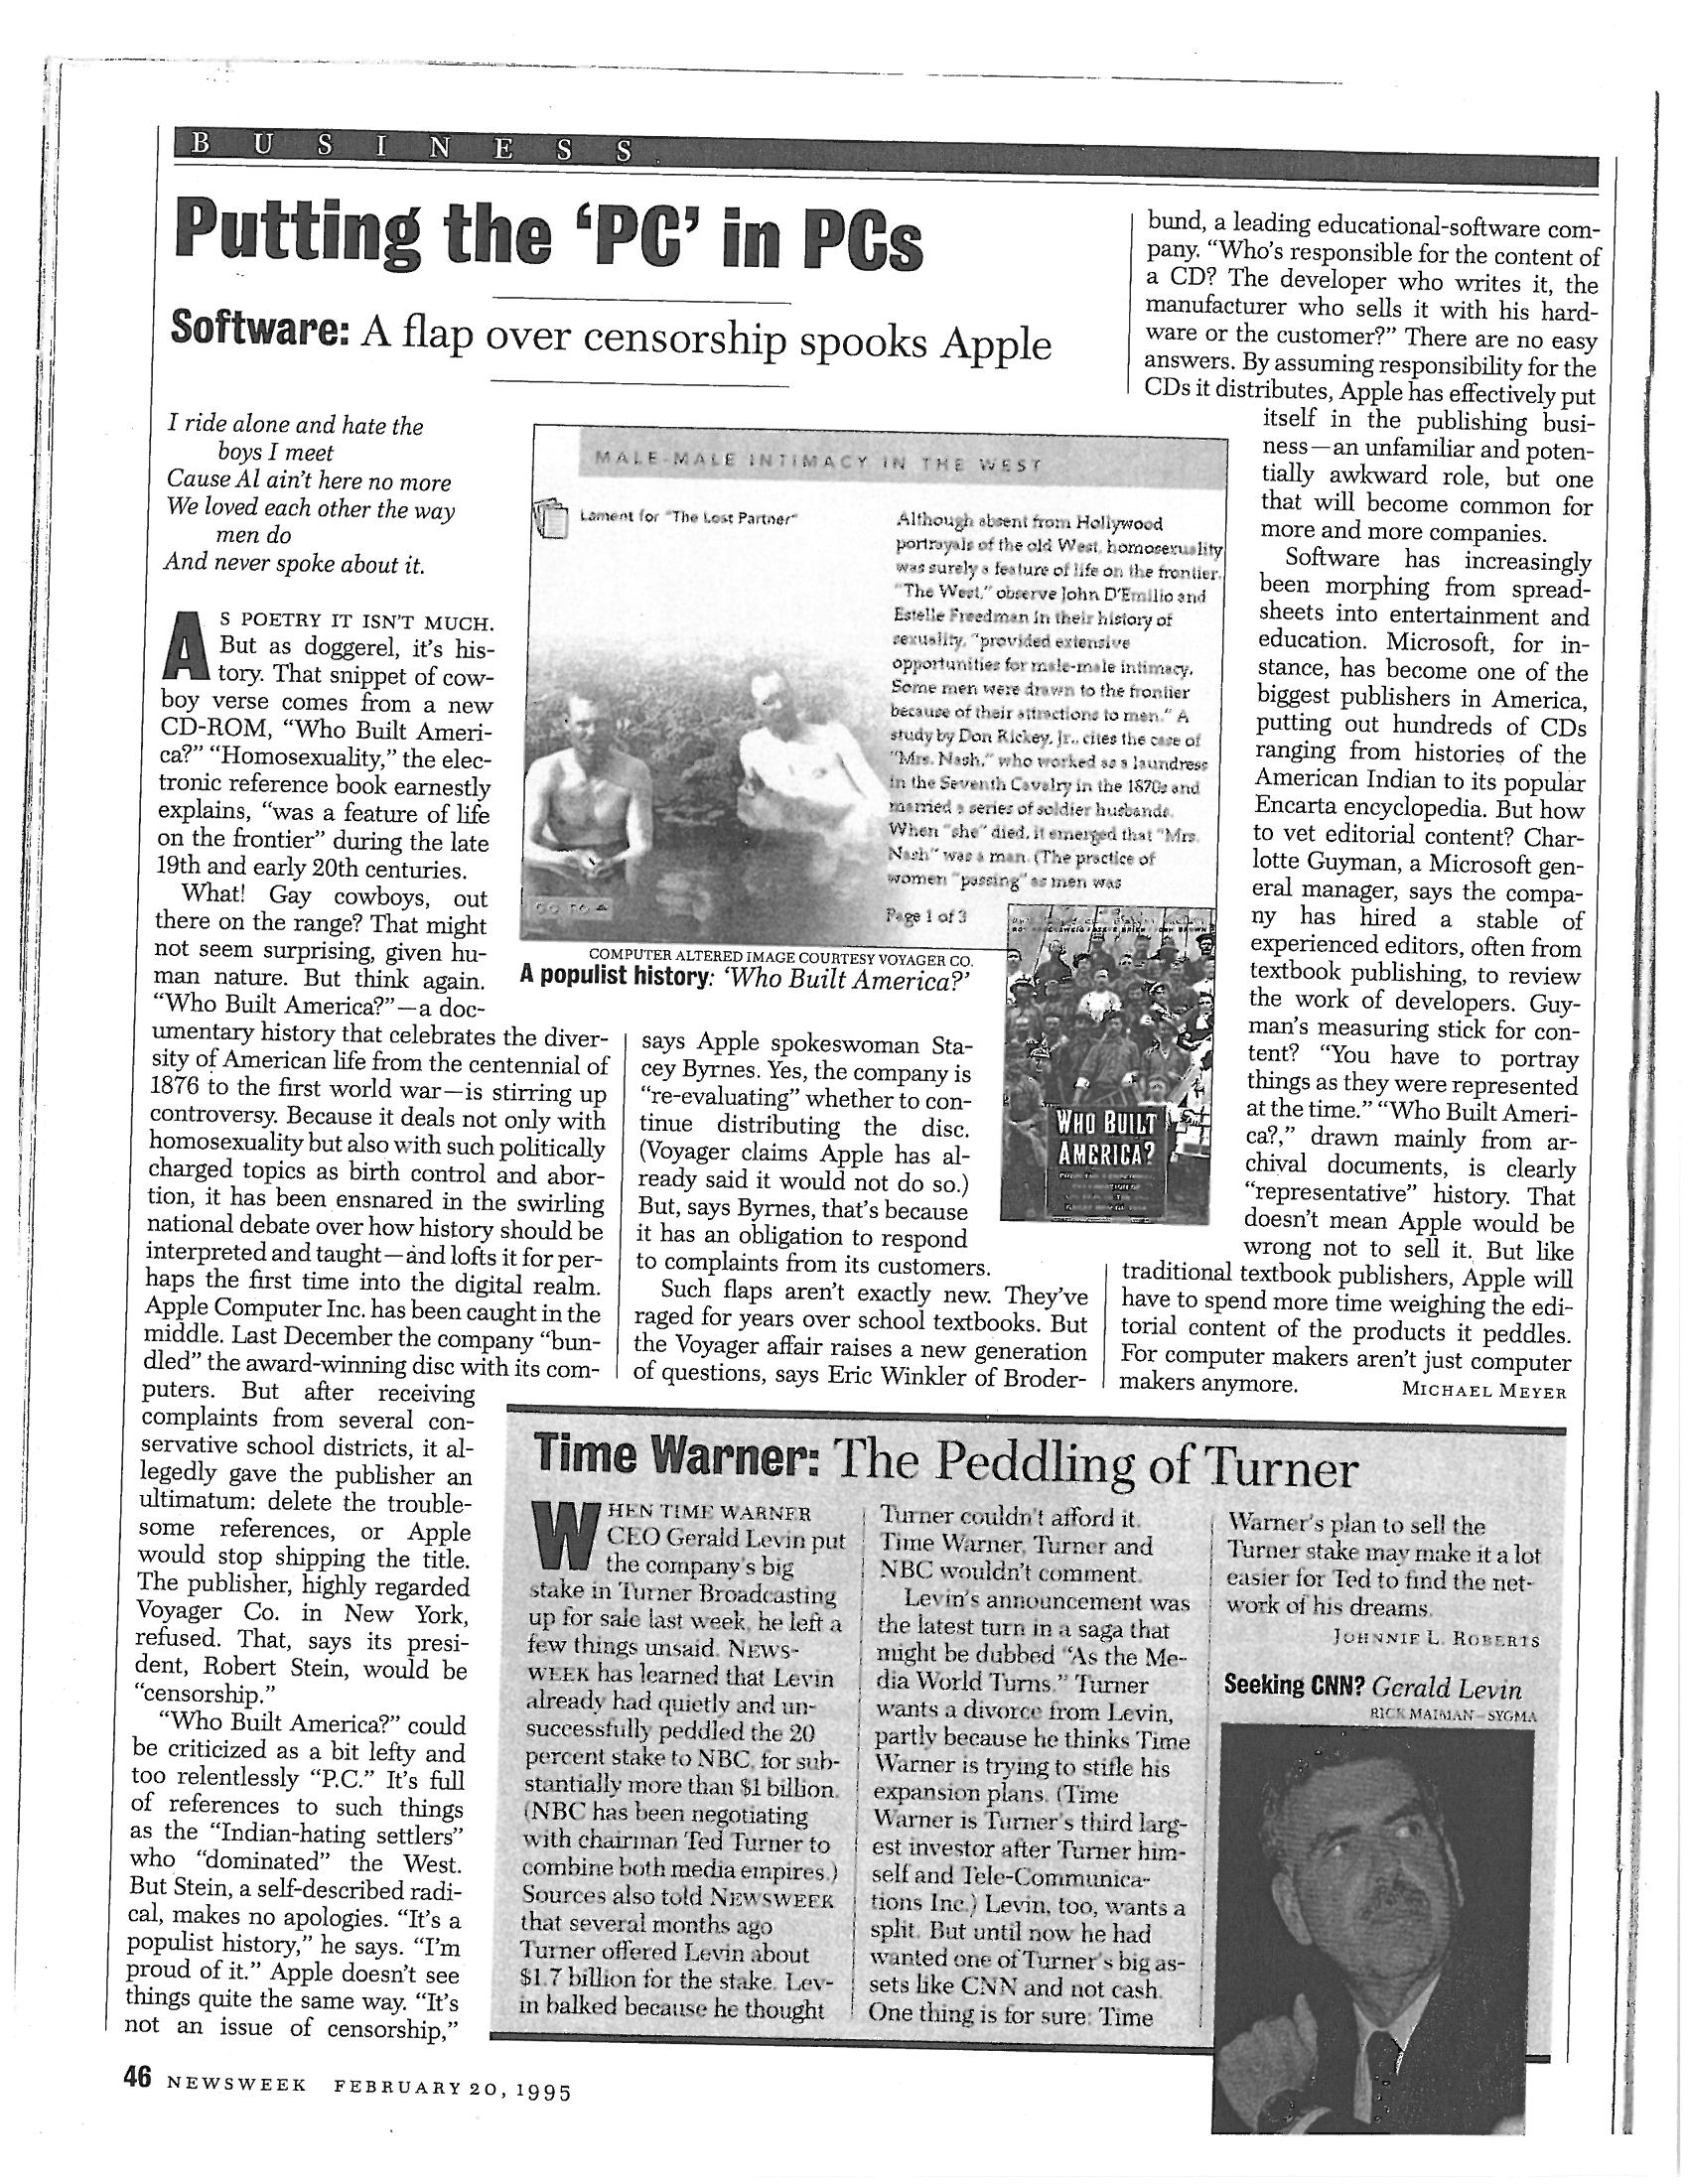
The Right, however, ironically failed in all the furor to notice the CD-ROM’s explicitly pro-worker/anti-capitalist politics! The Right tried to get Apple to remove the WBA? CD-ROM from the education packs, but Apple ultimately backed ASHP and WBA?, though only after much contention and negative publicity.[27]

Despite this political controversy, the first WBA? CD-ROM and early historical web projects like Ed Ayers’s Civil War-era The Valley of the Shadow (1993) helped imagine new possibilities for digital scholarship and digital presentations of historical work. I would suggest that the appearance of the first WBA? CD-ROM nearly a quarter century ago was one of the pioneering instances of the new digital history that contributed a decade later to the emergence of the Digital Humanities, making Roy, Josh, and me and our ASHP colleagues what I have termed in the title of this article and elsewhere in print “premature digital humanists.”[28] That said, I do believe we missed an opportunity to begin to build connections to other scholars outside of history who were undertaking similar digital work around the same time that we completed the WBA? CD-ROM in 1993. Jerry McGann, for example, was beginning his pioneering work at the University of Virginia on the Rossetti Archive and was writing his landmark study “The Rationale of HyperText” (McGann 1995). And while we became aware of each other’s work over the next half dozen years, we never quite came together to ponder the ways in which our very disparate disciplinary approaches to digital scholarship and presentation might have productively been linked up or at least put into some kind of active dialogue. As a result, digital history and digital literary studies occupied distinct academic silos, following quite different paths and embracing very different methodologies and ideas. And neither digital history nor digital literary studies had much in common with the digital new media artists who were also working in this same period and even earlier, grouped around the pioneering journal Ars Electronica.[29] This was a missed opportunity that I believe has hindered Digital Humanities from being more of a big tent and, more importantly, allowing it to become a more robust interdisciplinary force inside the academy and beyond.

In any case my digital history colleagues and I continued to pursue our own digital history work. Roy Rosenzweig, who taught at George Mason University, founded the Center for History and New Media in 1994 a year after the first WBA? CD-ROM appeared. Our two centers next collaborated on several award-winning digital history projects, including the History Matters website mentioned earlier, which made many of the public domain primary source documents presented originally in the WBA? CD-ROM available online. This proved to be a particularly useful and accessible way for teachers at both the high school and college levels to expose their students to a rich array of primary historical sources. And, following the September 11, 2001 terrorist attacks in New York and Washington, DC, our two centers were invited by the Sloan Foundation to collaborate on the development of the September 11 Digital Archive (9/11DA). As Josh Brown and I argued in an article on the creation of the 9/11DA, September 11th was “the first truly digital event of world historical importance: a significant part of its historical record—from e-mail to photography to audio to video—was expressed, captured, disseminated, or viewed in (or converted to) digital forms and formats” (Brier and Brown 2011, 101). It was also one of the first digital projects to be largely “crowdsourced,” given our open solicitation of ordinary people’s digital reminiscences, photos, and videos of the events of September 11th and its aftermath. As historians faced with the task of conceiving and building a brand new digital archive from scratch that focused on a single world historical event, we were also forced to take on additional roles as archivists and preservationists, something we had previously and happily left to professional librarians. We had to make judgments about what to include and exclude in the 9/11 archive, how and whether to display it online, how to contextualize those resources, and, when voluntary online digital submissions of materials by individuals proved insufficient to allow us to offer a fully-rounded picture of what happened, how to target particular groups (including Muslims, Latinos, and the Chinese community in lower Manhattan) with special outreach efforts to be able to include their collective and individual stories and memories in the 9/11DA. Our prior work in and long-term engagement with public history proved essential in this process. We ended up putting the archive online as we were building it, getting the initial iteration of the site up on the web in January 2002 well before the lion’s share of individual digital submissions started pouring in. The body of digital materials that came to constitute the September 11 Digital Archive ultimately totaled nearly a quarter million discrete digital items, making it one of the largest and most comprehensive digital repositories of materials on the September 11 attacks.[30]

While literary scholars confront similar issues of preservation of and access to the materials they are presenting in digital archives, they usually have had the good fortune to be able to rely on extant and often far more circumscribed print sources as the primary materials they are digitizing, annotating, and presenting to fellow scholars and the general public. Public historians who are collecting digital historical data to capture what happened in the recent past or even the present, as we were forced to do in the September 11 Digital Archive, do not have the luxury of basing our work on a settled corpus of information or data. We also faced the extremely delicate task of putting contemporary people’s voices online, making their deepest and most painful personal insights and feelings available to a public audience. Being custodians of that kind of source material brings special responsibilities and sensitivities that most literary digital humanists don’t have to deal with when constructing their digital archives. Our methodologies and larger public imperatives as digital historians are therefore different from those of digital literary scholars. This is especially true given our commitment in the 9/11DA and other digital history archiving projects like the CHNM’s “Hurricane Digital Memory Bank” (on the devastating 2005 Gulf Coast hurricanes Katrina and Rita), as well as ASHP’s current CUNY Digital History Archive project. The latter focuses on student and faculty activism across CUNY beginning in the late 1960s and on presenting historical materials that are deeply personal and politically consequential.[31]

It is important to note that while ASHP continued to collaborate on several ongoing digital history projects with CHNM (headed first by Dan Cohen and Tom Scheinfeldt after Roy’s death in 2007, and, since 2013, by Stephen Robertson), the two centers have moved in different directions in terms of doing digital history. CHNM’s efforts have focused largely on the development of important digital software tools. CHNM’s Zotero, for example, is used to help scholars manage their research sources, while its Omeka software offers a platform for publishing online collections and exhibitions. CHNM has also established a strong and direct connection to the Digital Humanities field, especially through its THATCamps, which are participant-directed digital skills workshops and meetings.[32] On the other hand, ASHP has stayed closer to its original purpose of developing a range of well curated and pedagogically appropriate multimedia historical source materials for use by teachers and students at both the high school and college levels, intended to help them understand and learn about the past. Emblematic of ASHP’s continuing work are The Lost Museum: Exploring Antebellum American Life and Culture and HERB: Social History for Every Classroom websites as well as Mission US, an adventure-style online series of games in which younger players take on the role of young people during critical moments in US history.[33]

From ASHP to ITP and the Digital Humanities

I moved on in my own academic career after formally leaving ASHP as its executive director in 1998, though I remained actively involved in a number of ongoing ASHP digital projects. These included the development of a second WBA? CD-ROM, covering the years from 1914 to 1946, which was published in 2001 (ASHP 2001) and is still available, as well as the aforementioned 9/11 Digital Archive and the CUNY Digital History Archive. As I morphed over three decades from analog media producer, to digital media producer, to digital archivist/digital historian, I became keenly aware of the need to extend the lessons of the public and digital history movements I helped to build to my own and my graduate students’ classroom practices. That was what drove me to develop the Interactive Technology and Pedagogy (ITP) certificate program at the CUNY Graduate Center in 2002. My goal was to teach graduate students that digital tools offered real promise beyond the restricted confines of academic research in a single academic field to help us reimagine and to reshape college classrooms and the entire teaching and learning experience, as my ASHP colleagues and I began doing more than 30 years ago with the Who Built America? education program. I always tell ITP students that I take the “P” in our name (“Pedagogy”) as seriously as I take the “T” (“Technology”) as a way to indicate the centrality of teaching and learning to the way the certificate program was conceived and has operated. I have coordinated ITP for almost 15 years now and will be stepping down as coordinator at the end of the spring 2017 term. I believe that the program has contributed as much to digital pedagogy and to the Digital Humanities as anything else I’ve been involved in, not only at the CUNY Graduate Center where I have been fortunate to have labored for almost all of my academic career, but also in the City University of New York as a whole.[34] One of the ITP program’s most important and ongoing contributions to the Digital Humanities and digital pedagogy fields has been the founding in 2011 of the online Journal of Interactive Technology and Pedagogy, which is produced twice-yearly and is directed by an editorial collective of digital scholars and digital pedagogues, including faculty, graduate students, and library staff.

Working with faculty colleagues like Matt Gold, Carlos Hernandez, Kimon Keramidas, Michael Mandiberg, and Maura Smale, with many highly motivated and skilled graduate students (too numerous to name here), and committed digital administrators and leaders like Luke Waltzer, Lisa Brundage, and Boone Gorges, as well as my ongoing work with long-time ASHP colleagues and comrades Josh Brown, Pennee Bender, Andrea Ades Vasquez, and Ellen Noonan, I have been blessed with opportunities to help create a robust community of digital practice at the Graduate Center and across CUNY. This community of scholars and digital practitioners has helped develop a progressive vision of digital technology and digital pedagogy that I believe can serve as a model for Digital Humanities work in the future. Though far from where I began forty years ago as a doctoral student with an IBM 360 computer and a stack of Fortran cards, my ongoing digital work at CUNY seems to me to be the logical and appropriate culmination of a career that has spanned many identities, including as a social and labor historian, public historian, digital historian, digital producer, and, finally, as a digital pedagogue who has made what I hope has been a modest contribution to the evolution and maturation of the field of Digital Humanities.

Notes

[1] Busa, an Italian Jesuit priest, traveled to New York City in 1949 and convinced IBM founder Thomas Watson to let him use IBM’s mainframe computer to generate a concordance of St. Thomas Aquinas’s writing, Busa’s life work. The best book on the key role of Father Busa is Steven E. Jones. 2016. Roberto Busa, S.J., and The Emergence of Humanities Computing: The Priest and the Punched Cards. New York: Routledge. Geoffrey Rockwell argues that an alternative to starting the history of DH with Busa is to look to the work of linguists who constructed word frequency counts and concordances as early as 1948 using simulations of computers (Rockwell 2007). Willard McCarty, one of the founders of humanities computing, has recently suggested that we could probably trace DH’s origins all the way back to Alan Turing’s “Machine” in the 1930s and 1940s. See McCarty, Willard. 2013. “What does Turing have to do with Busa?” Keynote for ACRH-3, Sofia Bulgaria, December 12. http://www.mccarty.org.uk/essays/McCarty,%20Turing%20and%20Busa.pdf.

[2] The origins of the TEI are described at http://www.tei-c.org/About/history.xml.

[3] See especially the following contributions on DH’s origins in Debates in the Digital Humanities: Matthew Kirschenbaum’s “What is DH and What’s It Doing in English Departments?” http://dhdebates.gc.cuny.edu/debates/text/38; and Steven E. Jones’s “The Emergence of the Digital Humanities (as the Network Is Everting)” http://dhdebates.gc.cuny.edu/debates/text/52. Kenneth M. Price and Ray Siemens reproduce a similar chronology of the literary origins of DH in their 2013 introduction to Literary Studies in the Digital Age (https://dlsanthology.commons.mla.org/introduction/). Willard McCarty is apparently working on his own history of literary computing from Busa to 1991. It is interesting to note, on the other hand, that Franco Moretti, a literary scholar, a key player in DH, and author of one of the field’s foundational texts, Graphs, Maps, Trees: Abstract Models for Literary History, readily acknowledges that academic work in quantitative history (which I discuss later in this essay) helped shape his important concept of “distant reading” (Moretti 2005, 1-30). Distant reading is a fundamental DH methodology at the core of digital literary studies.

[4] I am obviously not tilling this ground alone. There are several major projects underway to dig out the origins/history of Digital Humanities. One of the most promising is the efforts of Julianne Nyhan and her colleagues at the Department of Information Studies, University College London. Their “Hidden Histories: Computing and the Humanities c.1949-1980” project is based on a series of more than 40 oral history interviews with early DH practitioners with the intention of developing a deeper historical understanding of the disciplinary and interdisciplinary starting and continuation points of DH (Nyhan, et al. 2015; Nyhan and Flinn 2016).

[5] My colleague Michael Mandiberg has astutely noted that DH has other important origins and early influences besides literary studies and history. He suggests that DH “has been retracing the steps of new media art,” evidenced by the founding of Ars Electronica in 1979. https://www.aec.at/about/en/geschichte/.

[6] One of the pioneers of this new social history methodology, the Philadelphia Social History Project, based at the University of Pennsylvania, employed early mainframe computers in the late 1970s to create relational databases of historical information about the residents of Philadelphia (Thomas 2004).

[7] Radical History Review 25 (Winter 1980-81). The RHR issue had two other co-editors: Robert Entenmann and Warren Goldstein.

[8] The Presenting the Past collection included essays by Mike Wallace, Michael Frisch, and Roy Rosenzweig analyzing how historical consciousness has been constructed by history museums and mainstream historical publications, as well as essays by Linda Shopes, James Green, and Jeremy Brecher on how local groups in Baltimore, Boston, and in Connecticut’s Brass Valley created alternative ways and formats to understand and present their community’s history of oppositional struggles.

[9] Roy founded CHNM in 1994. The center was appropriately named for him following his death in 2007.

[10] A much-expanded version of Robertson’s original blog post appeared in the 2016 edition of Debates in the Digital Humanities (Gold and Klein 2016): http://dhdebates.gc.cuny.edu/debates/text/76.

[11] A useful introduction to quantification in history can be found at “What Is Quantitative History?” on the History Matters website: http://historymatters.gmu.edu/mse/numbers/what.html. Historian Cameron Blevins also discusses the origins of quantitative history in his essay in Debates in the Digital Humanities 2016: http://dhdebates.gc.cuny.edu/debates/text/77.

[12] Carl Bridenbaugh, a traditional historian of colonial American history, sharply attacked those who would “worship at the shrine of the Bitch goddess QUANTIFICATION” (quoted in Novick 1988, 383–84; capitalization in the original).

[13] I devoted a chapter of my dissertation to a critique of Thernstrom’s conclusions in Poverty and Progress and subsequent publications about the political impact of a large “floating proletariat” on working-class social mobility in US history, which he concluded served to undercut working-class consciousness. My dissertation argued otherwise.

[14] Thernstrom had been teaching at UCLA, where I first encountered him while working on my doctorate. He departed for Harvard in 1973 just in time for Roy Rosenzweig to become one of his doctoral students. Roy completed his dissertation in 1978 on workers in Worcester, Massachusetts, which incorporated little of Thernstrom’s quantitative methodology, but instead employed much of Herbert Gutman’s social and labor history approach. See Rosenzweig, Roy. 1985. Eight Hours for What We Will: Workers and Leisure in an Industrial City, 1870-1920. New York: Cambridge Univ. Press.

[15] Peter Passell, a Columbia economist, in a review of Time on the Cross, declared: “If a more important book about American history has been published in the last decade, I don’t know about it” (Passell 1974). The authors, Passell concluded, “have with one stroke turned around a whole field of interpretation and exposed the frailty of history done without science.”

[16] The strikes were detailed in the third and tenth printed annual reports of the US Commissioner of Labor. U.S. Commissioner of Labor, Third Annual Report. . .1887: Strikes and Lockouts (Washington D.C.: U.S. GPO, 1888); U.S. Commissioner of Labor, Tenth Annual Report. . .1894: Strikes and Lockouts (Washington D.C.: U.S. GPO, 1896).

[17] UCLA was one of the first campuses on the West Coast to develop a computer center, growing out of its early ARPANET involvement. With Stanford, UCLA had participated in the first host-to-host computer connection on ARPANET in October 1969. See http://internetstudies.ucla.edu/. I have no idea what model number of IBM 360 UCLA was using in 1975, but it may well have been the last in the line, the Model 195. See http://www-03.ibm.com/ibm/history/exhibits/mainframe/mainframe_FS360.html. See also Roy Rosenzweig’s (1998) important review essay on the history of the Internet, “Wizards, Bureaucrats, Warriors, and Hackers: Writing the History of the Internet”: http://rrchnm.org/essay/wizards-bureaucrats-warriors-hackers-writing-the-history-of-the-internet/.

[18] Melissa Terras and Julianne Nyhan, in an essay in Debates in the Digital Humanities 2016, tell a similar story about the unknown female keypunch operators Father Busa employed. http://dhdebates.gc.cuny.edu/debates/text/57.

[19] These included regression analyses, standard deviations, and F and T tests of variance.

[20] In a short blog post, Ramsay argued that DHers needed to “make things,” to learn how to code to really consider themselves DHers; it caused quite a flap. See Ramsay, Stephen. 2011. “Who’s In and Who’s Out.” Stephen Ramsay Blog. http://stephenramsay.us/text/2011/01/08/whos-in-and-whos-out/.

[21] The 1977 article was reprinted in Rabb, Theodore and Robert Rotbert, eds. 1981. Industrialization and Urbanization: Studies in Interdisciplinary History. Princeton, NJ: Princeton University Press and in excerpted form in Brenner, A., B. Day and M. Ness, eds. 2009. The Encyclopedia of Strikes in American History. Armonk, NY: M.E. Sharpe. One of the deans of U.S. labor history, David Montgomery, referenced our data and article and employed a similar set of statistical measures in his important article on nineteenth-century US strikes. Montgomery, David. 1980. “Strikes in Nineteenth-Century America.” Social Science History 4: 91-93.

[22] I continued to serve as ASHP’s executive director until 1998, when my shoes were ably filled by my long-time ASHP colleague, Joshua Brown, who continues to head the project to this day. I went on to serve as a senior administrator (Associate Provost and then Vice President) at the Graduate Center until 2009, when I resumed my faculty duties there.

[23] I needed special permission from our funder, the Ford Foundation, to spend ten thousand dollars of our grant to buy four Kaypro II computers (running the CPM operating system and the Wordstar word processing program) on which the entire first volume of WBA? was produced. I keep my old Kaypro II, a 30-pound “luggable,” and a large box of 5.25” floppy computer disks to show my students what early personal computers looked and felt like. My fascination with and desire to hold on to older forms of technology (I also drive a fully restored 1972 Oldsmobile Cutlass Supreme as well) apparently resonates with contemporary efforts to develop an archeology of older media formats and machines at places like the Media Archaeology Laboratory at the University of Colorado. See http://mediaarchaeologylab.com/.

[24] This decision to formally establish ASHP as part of the CUNY Graduate Center proved particularly important, given Herb Gutman’s untimely death in 1985 at age 56. ASHP became part of the Center for Media and Learning (CML) that we founded at CUNY in 1990, which has also provided the institutional home for the Graduate Center’s New Media Lab (NML), which I co-founded in 1998 and continue to co-direct. The NML operates under the aegis of the CML.

[25] I recounted Roy’s and my visit in 1989 to a Washington, DC trade show of computer-controlled training modules and programs in my tribute to him after his death in 2007. See http://thanksroy.org/items/show/501.

[26] Because the first WBA? CD-ROM was produced for earlier Mac (OS9) and PC (Windows 95) operating systems, it is no longer playable on current computer systems, yet another orphaned piece of digital technology in a rapidly evolving computing landscape.

[27] Michael Meyer, “Putting the ‘PC’ in PCs,” Newsweek (February 20, 1995): 46; Jeffrey A. Trachtenberg, “U.S. History on a CD-ROM Stirs Up a Storm,” Wall Street Journal (February 10, 1995): B1-B2; and Juan Gonzalez. “Apple’s Big Byte Out of History.” New York Daily News (February 8, 1995): 10. We managed to fend off the Right-wing attack with what was then an unheard of barrage of email messages that we were able to generate from librarians and school teachers all over the world. It’s important to recall that email was still a relatively new technology in 1995 (AOL, Prodigy, and CompuServe were all launched in that year). The librarians emailed Apple in droves, convincing the company that unless it kept the WBA? CD-ROM in its education packs, the librarians would be unable to recommend future purchases of Apple computers for their schools. After the appointment of a panel of unnamed educators had endorsed the value of the WBA? CD-ROM, Apple resumed distributing copies of the disk in their education bundles for another year, with the total number of distributed WBA? CD-ROMs reaching almost 100,000 copies.

[28] I appropriated the “premature” phrase and explained its historical origins in the mid-1930s fight against fascism in a footnote to my article, “Where’s the Pedagogy? The Role of Teaching and Learning in the Digital Humanities” (Gold 2012, fn12). The standard work on digital history is Dan Cohen and Roy Rosenzweig. 2005. Digital History: A Guide to Gathering, Preserving, and Presenting the Past on the Web. Philadelphia: University of Pennsylvania Press.

[29] Lev Manovich (2001) in The Language of New Media notes that artists began using digital technology during the 1990s to extend and enhance their work, a key moment in what he describes as “the computerization of culture” (221).

[30] It remains, to this day, in the top 15 results one gets out of the nearly 200 million results in a Google search for “September 11.”

[31] See CHNM’s Sheila Brennan and Mills Kelly’s essay on the Hurricane Digital Memory Bank, “Why Collecting History Online is Web 1.5,” on the CHNM website at http://chnm.gmu.edu/essays-on-history-new-media/essays/?essayid=47. The initial online iteration of the CUNY Digital History Archive can be found at http://cdha.cuny.edu/.

[32] Descriptions and details about CHNM’s various projects described here can be found at http://chnm.gmu.edu/.

[33] Descriptions and details about ASHP’s various projects described here can be found on the ASHP website: http://ashp.cuny.edu/.

[34] My contribution to the 2012 edition of Debates in the Digital Humanities was an article entitled “Where’s the Pedagogy? The Role of Teaching and Learning in the Digital Humanities,” which argued that DHers need to pay more attention to pedagogy in their work. http://dhdebates.gc.cuny.edu/debates/text/8.

Bibliography

American Social History Project. 1990, 1992. Who Built America? Working People and Nation’s Economy, Politics, Culture and Society. New York: Pantheon.

———. 1993. Who Built America: From the Centennial Celebration of 1876 to the Great War of 1914 (CD-ROM). Santa Monica, CA: Voyager Co.

———. 2001. Who Built America? From the Great War of 1914 to the Dawn of the Atomic Age (CD-ROM). New York: Worth Publishers.

American Social History Project and Center for History and New Media. 1998. History Matters: The U.S. History Survey on the Web. http://historymatters.gmu.edu.

Amsden, Jon and Stephen Brier. 1977. “Coal Miners on Strike: The Transformation of Strike Demands and the Formation of a National Union.” The Journal of Interdisciplinary History: 8, 583–616.

Aptheker, Herbert. 1943 (1963). American Negro Slave Revolts. New York: International Publishers.

Benson, Susan Porter, Stephen Brier, and Roy Rosenzweig. 1986. Presenting the Past: Essays on History and the Public. Philadelphia: Temple University Press.

Brier, Stephen. 1992. “‘The Most Persistent Unionists’: Class Formation and Class Conflict in the Coal Fields and the Emergence of Interracial and Interethnic Unionism, 1880 –1904.” PhD diss., UCLA.

Brier, Stephen and Joshua Brown. 2011. “The September 11 Digital Archive: Saving the Histories of September 11, 2001.” Radical History Review 111 (Fall 2011): 101-09.

Fogel, Robert William and Stanley L. Engerman. 1974. Time on the Cross: The Economics of American Negro Slavery. Boston: Little, Brown and Company.

Gold, Matthew, ed. 2012. Debates in the Digital Humanities. Minneapolis: University of Minnesota Press.

Gold, Matthew and Lauren Klein, eds. 2016. Debates in the Digital Humanities 2016. Minneapolis: University of Minnesota Press.

Graham, S., I. Milligan, and S. Weingart. 2015. “Early Emergences: Father Busa, Humanities Computing, and the Emergence of the Digital Humanities.” The Historian’s Macroscope: Big Digital History. http://www.themacroscope.org/?page_id=601.

Gutman, Herbert. 1975. Slavery and the Numbers Game: A Critique of Time on the Cross. Urbana, IL: University of Illinois Press.

Hockey, Susan. 2004. “The History of Humanities Computing.” In A Companion to Digital Humanities, edited by Susan Schreibman, Roy Siemens, and John Unsworth. Oxford: Blackwell. http://www.digitalhumanities.org/companion/view?docId=blackwell/9781405103213/9781405103213.xml&chunk.id=ss1-2-1.

Lubar, Steven. 1992. ‘Do Not Fold, Spindle or Mutilate’: A Cultural History of the Punch Card.” Journal of American Culture 15: 43–55.

Manovich, Lev. 2001. The Language of New Media. Cambridge: The MIT Press.

McCarty, Willard. 2011. “Beyond Chronology and Profession: Discovering How to Write a History of the Digital Humanities.” Willard McCarty web page. University College London. http://www.mccarty.org.uk/essays/McCarty,%20Beyond%20chronology%20and%20profession.pdf.

McGann, Jerome. 1995. “The Rationale of Hypertext.” http://www2.iath.virginia.edu/public/jjm2f/rationale.html.

Moretti, Frank. 2005. Graphs, Maps, Trees: Abstract Models for Literary History. Brooklyn, NY: Verso.

Noiret, Serge. 2012 [2015]. “Digital History: The New Craft of (Public) Historians.” http://dph.hypotheses.org/14.

Novick, Peter. 1988. That Noble Dream: The ‘Objectivity Question’ and the American Historical Profession. New York: Cambridge Univ. Press.

Nyhan, Julianne, Andrew Flinn, and Anne Welsh. 2015. “Oral History and the Hidden Histories Project: Towards Histories of Computing in the Humanities.” Digital Scholarship in the Humanities 30: 71-85. Oxford: Oxford University Press. http://dsh.oxfordjournals.org/content/30/1/71/.

Nyhan, Julianne and Andrew Flinn. 2016. Computation and the Humanities: Towards an Oral History of Digital Humanities. Cham, Switzerland: Springer Open. http://link.springer.com/book/10.1007%2F978-3-319-20170-2.

Passell, Peter. 1974. “An Economic Analysis of that Peculiarly Economic Institution.” New York Times. April 28. http://www.nytimes.com/1974/04/28/archives/an-economic-analysis-of-that-peculiarly-economic-institution-vol-ii.html.

Robertson, Stephen. 2014. “The Differences between Digital History and Digital Humanities.” Stephen Robertson’s Blog. May 23. https://drstephenrobertson.com/blog-post/the-differences-between-digital-history-and-digital-humanities/.

Rockwell, Geoffrey. 2007. “An Alternate Beginning to Humanities Computing.” Geoffrey Rockwell’s Research Blog. May 2. http://theoreti.ca/?p=1608.

Rosenzweig, Roy. 1998. “Wizards, Bureaucrats, Warriors, and Hackers: Writing the History of the Internet.” American Historical Review 103: 1530-52. http://rrchnm.org/essay/wizards-bureaucrats-warriors-hackers-writing-the-history-of-the-internet/

Shorter, Edward. 1971. The Historian and the Computer: A Practical Guide. Englewood Cliffs, NJ: Prentice-Hall.

Spiro, Lisa. 2012. “‘This is Why We Fight’: Defining the Values of the Digital Humanities.” In Debates in the Digital Humanities, edited by Matthew Gold. Minneapolis: University of Minnesota Press. http://dhdebates.gc.cuny.edu/debates/text/13.

Stampp, Kenneth. 1956 (1967). The Peculiar Institution: Slavery in the Ante-Bellum South. New York: Knopf.

Thernstrom, Stephan. 1964. Poverty and Progress: Social Mobility in a Nineteenth Century City. Cambridge: Harvard University Press.

Thomas. William G. II. 2004. “Computing and the Historical Imagination.” In A Companion to Digital Humanities, edited by Susan Schreibman, Ray Siemens, and John Unsworth. Oxford: Blackwell.

Woodward, C. Vann. 1974. “The Jolly Institution.” New York Review of Books. May 2.

Acknowledgments

The author thanks Jon Amsden, Josh Brown, Matt Gold, Steven Lubar, Michael Mandiberg, Julianne Nyhan, Stephen Robertson, and Luke Waltzer for helpful comments and suggestions on an earlier draft of this essay.

About the Author

Stephen Brier is a social and labor historian and educational technologist who teaches in the PhD program in Urban Education and is the founder and coordinator of the Interactive Technology and Pedagogy doctoral certificate program, both at the CUNY Graduate Center. He served for eighteen years as the founding director of the American Social History Project/Center for Media and Learning and as a senior administrator for eleven years at the Graduate Center. Brier helped launch the Journal of Interactive Technology and Pedagogy in 2011 and served as a member of the journal’s editorial collective until 2017.

96

A Survey of Digital Humanities Programs

Abstract

The number of digital humanities programs has risen steadily since 2008, adding capacity to the field. But what kind of capacity, and in what areas? This paper presents a survey of DH programs in the Anglophone world (Australia, Canada, Ireland, the United Kingdom, and the United States), including degrees, certificates, and formalized minors, concentrations, and specializations. By analyzing the location, structure, and disciplinarity of these programs, we examine the larger picture of DH, at least insofar as it is represented to prospective students and cultivated through required coursework. We also explore the activities that make up these programs, which speak to the broader skills and methods at play in the field, as well as some important silences. These findings provide some empirical perspective on debates about teaching DH, particularly the attention paid to theory and critical reflection. Finally, we compare our results (where possible) to information on European programs to consider areas of similarity and difference, and sketch a broader picture of digital humanities.

Introduction

Much has been written of what lies inside (and outside) the digital humanities (DH). A fitting example might be the annual Day of DH, when hundreds of “DHers” (digital humanists) write about what they do and how they define the field (see https://twitter.com/dayofdh). Read enough of their stories and certain themes and patterns may emerge, but difference and pluralism will abound. More formal attempts to define the field are not hard to find—there is an entire anthology devoted to the subject (Terras, Nyhan, and Vanhoutte 2013)—and others have approached DH by studying its locations (Zorich 2008; Prescott 2016), its members (Grandjean 2014a, 2014b, 2015), their communication patterns (Ross et al. 2011; Quan-Haase, Martin, and McCay-Peet 2015), conference submissions (Weingart 2016), and so forth.

A small but important subset of research looks at teaching and learning as a lens through which to view the field. Existing studies have examined course syllabi (Terras 2006; Spiro 2011) and the development of specific programs and curricula (Rockwell 1999; Siemens 2001; Sinclair 2001; Unsworth 2001; Unsworth and Butler 2001; Drucker, Unsworth, and Laue 2002; Sinclair & Gouglas 2002; McCarty 2012; Smith 2014). In addition, there are pedagogical discussions about what should be taught in DH (Hockey 1986, 2001; Mahony & Pierazzo 2002; Clement 2012) and its broader relationship to technology, the humanities, and higher education (Brier 2012; Liu 2012; Waltzer 2012).

This study adds to the literature on teaching and learning by presenting a survey of existing degree and certificate programs in DH. While these programs are only part of the activities that make up the broader world of DH, they provide a formal view of training in the field and, by extension, of the field itself. Additionally, they reflect the public face of DH at their institutions, both to potential students and to faculty and administrators outside of DH. By studying the requirements of these programs (especially required coursework), we explore the activities that make up DH, at least to the extent that they are systematically taught and represented to students during admissions and recruitment, as well as where DH programs position themselves within and across the subject boundaries of their institutions. These activities speak to broader skills and methods at play in DH, as well as some important silences. They also provide an empirical perspective on pedagogical debates, particularly the attention paid to theory and critical reflection

Background

Melissa Terras (2006) was the first to point to the utility of education studies in approaching the digital humanities (or what she then called “humanities computing”). In the broadest sense, Terras distinguishes between subjects, which are usually associated with academic departments and defined by “a set of core theories and techniques to be taught” (230), and disciplines, which lack departmental status yet still have their own identities, cultural attributes, communities of practice, heroes, idols, and mythology. After analyzing four university courses in humanities computing, Terras examines other aspects of the community such as its associations, journals, discussion groups, and conference submissions. She concludes that humanities computing is a discipline, although not yet a subject: “the community exists, and functions, and has found a way to continue disseminating its knowledge and encouraging others into the community without the institutionalization of the subject” (242). Terras notes that humanities computing scholars, lacking prescribed activities, have freedom in developing their own research and career paths. She remains curious, however, about the “hidden curriculum” of the field at a time when few formal programs yet existed.

Following Terras, Lisa Spiro (2011) takes up this study of the “hidden curriculum” by collecting and analyzing 134 English-language syllabi from DH courses offered between 2006–2011. While some of these courses were offered in DH departments (16, 11.9%), most were drawn from other disciplines, including English, history, media studies, interdisciplinary studies, library and information science, computer science, rhetoric and composition, visual studies, communication, anthropology, and philosophy. Classics, linguistics, and other languages were missing. Spiro analyzes the assignments, readings, media types, key concepts, and technologies covered in these courses, finding (among other things) that DH courses often link theory to practice; involve collaborative work on projects; engage in social media such as blogging or Twitter; focus not only on text but also on video, audio, images, games, maps, simulation, and 3D modeling; and reflect contemporary issues such as data and databases, openness and copyright, networks and networking, and interaction. Finally, Spiro presents a list of terms she expected to see more often in these syllabi, including “argument,” “statistics,” “programming,” “representation,” “interpretation,” “accessibility,” “sustainability,” and “algorithmic.”

These two studies form the broad picture of DH education. More recent studies have taken up DH teaching and learning within particular contexts, such as community colleges (McGrail 2016), colleges of liberal arts and science (Alexander & Davis 2012; Buurma & Levine 2016), graduate education (Selisker 2016), libraries (Rosenblum, et al., 2016; Varner 2016; Vedantham & Porter 2016) and library and information science education (Senchyne 2016), and the public sphere (Brennan 2016; Hsu 2016). These accounts stress common structural challenges and opportunities across these contexts. In particular, many underscore assumptions made about and within DH, including access to technology, institutional resources, and background literacies. In addition, many activities in these contexts fall outside of formal degrees and programs or even classroom learning, demonstrating the variety of spaces in which DH may be taught and trained.

Other accounts have drawn the deep picture of DH education by examining the development of programs and courses at specific institutions, such as McMaster University (Rockwell 1999), University of Virginia (Unsworth 2001; Unsworth and Butler 2001; Drucker, Unsworth, and Laue 2002), University of Alberta (Sinclair & Gouglas 2002), King’s College London (McCarty 2012), and Wilfrid Laurier University (Smith 2014), among others. Abstracts from “The Humanities Computing Curriculum / The Computing Curriculum in the Arts and Humanities” Conference in 2001 contain references to various institutions (Siemens 2001), as does a subsequent report on the conference (Sinclair 2001). Not surprisingly, these accounts often focus on the histories and peculiarities of each institution, a “localization” that Knight (2011) regards as necessary in DH.

Our study takes a program-based approach to studying teaching and learning in DH. While formal programs represent only a portion of the entire DH curricula, they are important in several respects: First, they reflect intentional groupings of courses, concepts, skills, methods, techniques, and so on. As such, they purport to represent the field in its broadest strokes rather than more specialized portions of it (with the exception of programs offered in specific areas, such as book history and DH). Second, these programs, under the aegis of awarding institutions and larger accrediting bodies, are responsible for declaring explicit learning outcomes of their graduates, often including required courses. These requirements form one picture of what all DHers are expected to know upon graduation (at a certain level), and this changing spectrum of competencies presumably reflects corresponding changes in the field over time. Third, formal DH programs organize teaching, research, and professional development in the field; they are channels through which material and symbolic capital flow, making them responsible, in no small part, for shaping the field itself. Finally, these programs, their requirements, and coursework are one way—perhaps the primary way—in which prospective students encounter the field and make choices about whether to enroll in a DH program and, if so, which one. These programs are also consulted by faculty and administrators developing new programs at their own institutions, both for common competencies and for distinguishing features of particular programs.

In addition to helping define the field, a study of formal DH programs also contributes to the dialogue around pedagogy in the field. Hockey, for example, has long wondered whether programming should be taught (1986) and asks, “How far can the need for analytical and critical thinking in the humanities be reconciled with the practical orientation of much work in humanities computing?” (2001). Also skeptical of mere technological skills, Simon Mahony and Elena Pierazzo (2002) argue for teaching methodologies or “ways of thinking” in DH. Tanya Clement examines multiliteracies in DH (e.g., critical thinking, commitment, community, and play), which help to push the field beyond “training” to “a pursuit that enables all students to ask valuable and productive questions that make for ‘a life worth living’” (2012, 372).

Others have called on DH to engage more fully in critical reflection, especially in relation to technology and the role of the humanities in higher education. Alan Liu notes that much DH work has failed to consider “the relation of the whole digital juggernaut to the new world order,” eschewing even clichéd topics such as “the digital divide,” “surveillance,” “privacy,” and “copyright” (2012, 491). Steve Brier (2012) points out that teaching and learning are an afterthought to many DHers, a lacuna that misses the radical potential of DH for transforming teaching and professional development. Luke Walzer (2012) observes that DH has done little to help protect and reconceptualize the role of the humanities in higher education, long under threat from austerity measures and perceived uselessness in the neoliberal academy (Mowitt 2012).

These and other concerns point to longstanding questions about the proper balance of technological skills and critical reflection in DH. While a study of existing DH programs cannot address the value of critical reflection, it can report on the presence (or absence) of such reflection in required coursework and program outcomes. Thus, it is part of a critical reflection on the field as it stands now, how it is taught to current students, and how such training will shape the future of the field. It can also speak to common learning experiences within DH (e.g., fieldwork, capstones), as well as disciplinary connections, particularly in program electives. These findings, together with our more general findings about DH activities, give pause to consider what is represented in, emphasized by, and omitted from the field at its most explicit levels of educational training.

Methods

This study involved collection of data about DH programs, coding descriptions of programs and courses using a controlled vocabulary, and analysis and visualization.

Data Collection

We compiled a list of 37 DH programs active in 2015 (see Appendix A), drawn from listings in the field (UCLA Center for Digital Humanities 2015; Clement 2015), background literature, and web searches (e.g., “digital humanities masters”). In addition to degrees and certificates, we included minors and concentrations that have formal requirements and coursework, since these programs can be seen as co-issuing degrees with major areas of study and as inflecting those areas in significant ways. We did not include digital arts or emerging media programs in which humanities content was not the central focus of inquiry. In a few cases, the listings or literature mentioned programs that could not be found online, but we determined that these instances were not extant programs—some were initiatives or centers misdescribed, others were programs in planning or simply collections of courses with no formal requirements—and thus fell outside the scope of this study. We also asked for the names of additional programs at a conference presentation, in personal emails, and on Twitter. Because our sources and searches are all English-language, the list of programs we collected are all programs taught in Anglophone countries. This limits what we can say about global DH.

For each program, we made a PDF of the webpage on which its description appears, along with a plain text file of the description. We recorded the URL of each program and information about its title; description; institution; school, division, or department; level (graduate or undergraduate); type (degree or otherwise); year founded; curriculum (total credits, number and list of required and elective courses); and references to independent research, fieldwork, and final deliverables. After identifying any required courses for each program, we looked up descriptions of those courses in the institution’s course catalog and recorded them in a spreadsheet.

Coding and Intercoder Agreement

To analyze the topics covered by programs and required courses, we applied the Taxonomy of Digital Research Activities in the Humanities (TaDiRAH 2014a), which attempts to capture the “scholarly primitives” of the field (Perkins et al. 2014). Unsworth (2000) describes these primitives as “basic functions common to scholarly activities across disciplines, over time, and independent of theoretical orientation,” obvious enough to be “self-understood,” and his preliminary list includes ‘Discovering’, ‘Annotating’, ‘Comparing’, ‘Referring’, ‘Sampling’, ‘Illustrating’, and ‘Representing’.

We doubt that any word—or classification system—works in this way. Language is always a reflection of culture and society, and with that comes questions of power, discipline/ing, and field background. Moreover, term meaning shifts over time and across locations. Nevertheless, we believe classification schema can be useful in organizing and analyzing information, and that is the spirit in which we employ TaDiRAH here.

TaDiRAH is one of several classification schema in DH and is itself based on three prior sources: the arts-humanities.net taxonomy of DH projects, tools, centers, and other resources; the categories and tags originally used by the DiRT (Digital Research Tools) Directory (2014); and headings from “Doing Digital Humanities,” a Zotero bibliography of DH literature (2014) created by the Digital Research Infrastructure for Arts and Humanities (DARIAH). The TaDiRAH version used in this study (v. 0.5.1) also included two rounds of community feedback and subsequent revisions (Dombrowski and Perkins 2014). TaDiRAH’s controlled vocabulary terms are arranged into three broad categories: activities, objects, and techniques. Only activities terms were used in this study because the other terms lack definitions, making them subject to greater variance in interpretation. TaDiRAH contains forty activities terms organized into eight parent terms (‘Capture’, ‘Creation’, ‘Enrichment’, ‘Analysis’, ‘Interpretation’, ‘Storage’, ‘Dissemination’, and ‘Meta-Activities’).

TaDiRAH was built in conversation with a similar project at DARIAH called the Network for Digital Methods in the Arts and Humanities (NeDiMAH) and later incorporated into that project (2015). NeDiMAH’s Methods Ontology (NeMO) contains 160 activities terms organized into five broad categories (‘Acquiring’, ‘Communicating’, ‘Conceiving’, ‘Processing’, ‘Seeking’) and is often more granular than TaDiRAH (e.g., ‘Curating’, ‘Emulating’, ‘Migrating’, ‘Storing’, and ‘Versioning’ rather than simply ‘Preservation’). While NeMO may have other applications, we believe it is too large to be used in this study. There are many cases in which programs or even course descriptions are not as detailed as NeMO in their language, and even the forty-eight TaDiRAH terms proved difficult to apply because of their number and complexity. In addition, TaDiRAH has been applied in DARIAH’s DH Course Registry of European programs, permitting some comparisons between those programs and the ones studied here.

In this study, a term was applied to a program/course description whenever explicit evidence was found that students completing the program or course would be guaranteed to undertake the activities explicitly described in that term’s definition. In other words, we coded for minimum competencies that someone would have after completing a program or course. The narrowest term was applied whenever possible, and multiple terms could be applied to the same description (and, in most cases, were). For example, a reference to book digitization would be coded as ‘Imaging’:

Imaging refers to the capture of texts, images, artefacts or spatial formations using optical means of capture. Imaging can be made in 2D or 3D, using various means (light, laser, infrared, ultrasound). Imaging usually does not lead to the identification of discrete semantic or structural units in the data, such as words or musical notes, which is something DataRecognition accomplishes. Imaging also includes scanning and digital photography.

If there was further mention of OCR (optical character recognition), that would be coded as ‘DataRecognition’ and so on. To take another example, a reference to visualization and other forms of analysis would be coded both as ‘Visualization’ and as its parent term, ‘Analysis’, if no more specific child terms could be identified.

In some cases, descriptions would provide a broad list of activities happening somewhere across a program or course but not guaranteed for all students completing that program or course (e.g., “Through our practicum component, students can acquire hands-on experience with innovative tools for the computational analysis of cultural texts, and gain exposure to new methods for analyzing social movements and communities enabled by new media networks.”). In these cases, we looked for further evidence before applying a term to that description.

Students may also acquire specialty in a variety of areas, but this study is focused on what is learned in common by any student who completes a specific DH program or course; as such, we coded only cases of requirements and common experiences. For the same reason, we coded only required courses, not electives. Finally, we coded programs and required courses separately to analyze whether there was any difference in stated activities at these two levels.

To test intercoder agreement, we selected three program descriptions at random and applied TaDiRAH terms to each. In only a handful of cases did all three of us agree on our term assignments. We attribute this low level of agreement to the large number of activities terms in TaDiRAH, the complexity of program/course descriptions, questions of scope (whether to use a broader or narrower term), and general vagueness. For example, a program description might allude to work with texts at some point, yet not explicitly state text analysis until later, only once, when it is embedded in a list of other examples (e.g., GIS, text mining, network analysis), with a reference to sentiment analysis elsewhere. Since texts could involve digitization, publishing, or other activities, we would not code ‘Text analysis’ immediately, and we would only code it if students would were be guaranteed exposure to this such methods in the program. To complicate matters further, there is no single term for text analysis in TaDiRAH—it spans across four (‘Content analysis’, ‘Relational analysis’, ‘Structural analysis’, and ‘Stylistic analysis’)—and one coder might apply all four terms, another only some, and the third might use the parent term ‘Analysis’, which also includes spatial analysis, network analysis, and visualization.

Even after reviewing these examples and the definitions of specific TaDiRAH terms, we could not reach a high level of intercoder agreement. However, we did find comparing our term assignments to be useful, and we were able to reach consensus in discussion. Based on this experience, we decided that each of us would code every program/course description and then discuss our codings together until we reached a final agreement. Before starting our preliminary codings, we discussed our understanding of each TaDiRAH term (in case it had not come up already in the exercise). We reviewed our preliminary codings using a visualization showing whether one, two, or three coders applied a term to a program/course description. In an effort to reduce bias, especially framing effects (cognitive biases that result from the order in which information is presented), the visualization did not display who had coded which terms. If two coders agreed on a term, they explained their codings to the third and all three came to an agreement. If only one coder applied a term, the other two explained why they did not code for that term and all three came to an agreement. Put another way, we considered every term that anyone applied, and we considered it under the presumption that it would be applied until proven otherwise. Frequently, our discussions involved pointing to specific locations in the program/course descriptions and referencing TaDiRAH definitions or notes from previous meetings when interpretations were discussed.

In analyzing our final codings, we used absolute term frequencies (the number of times a term was applied in general) and weighted frequencies (a proxy for relative frequency and here a measure of individual programs and courses). To compute weighted frequencies, each of the eight parent terms were given a weight of 1, which was divided equally among their subterms. For example, the parent term ‘Dissemination’ has six subterms, so each of those were assigned an equal weight of one-sixth, whereas ‘Enrichment’ has three subterms, each assigned a weight of one-third. These weights were summed by area to show how much of an area (relatively speaking) is represented in program/course descriptions, regardless of area size. If all the subterms in an area are present, that entire area is present—just as it would be if we had applied only the broader term in the first place. These weighted frequencies are used only where programs are displayed individually.

Initially, we had thought about comparing differences in stated activities between programs and required courses. While we found some variations (e.g., a program would be coded for one area of activities but not its courses and vice versa), we also noticed cases in which the language used to describe programs was too vague to code for activities that were borne out in required course descriptions. For this reason and to be as inclusive as possible with our relatively conservative codings, we compared program and course data simultaneously in our final analysis. Future studies may address the way in which program descriptions connect to particular coursework, and articulating such connections may help reveal the ways in which DH is taught (in terms of pedagogy) rather than only its formal structure (as presented here).

Analysis and Visualization

In analyzing program data, we examined the overall character of each program (its title), its structure (whether it grants degrees and, if so, at what level), special requirements (independent study, final deliverables, fieldwork), and its location, both in terms of institutional structure (e.g., departments, labs, centers) and discipline(s). We intended to analyze more thoroughly the number of required courses as compared to electives, the variety of choice students have in electives, and the range of departments in which electives are offered. These comparisons proved difficult: even within an American context, institutions vary in their credit hours and the formality of their requirements (e.g., choosing from a menu of specific electives, as opposed to any course from a department or “with permission”). These inconsistencies multiply greatly in an international context, and so we did not undertake a quantitative study of the number or range of required and elective courses.

Program data and codings were visualized using the free software Tableau Public. All images included in this article are available in a public workbook at https://public.tableau.com/views/DigitalHumanitiesProgramsSurvey/Combined. As we discuss in the final section, we are also building a public-facing version of the data and visualizations, which may be updated by members of the DH community. Thus, the data presented here can and should change over time, making these results only a snapshot of DH in some locations at the present.

Anglophone Programs

The number of DH programs in Anglophone countries has risen sharply over time, beginning in 1991 and growing steadily by several programs each year since 2008 (see Figure 1). This growth speaks to increased capacity in the field, not just by means of centers, journals, conferences, and other professional infrastructure, but also through formal education. Since 2008, there has been a steady addition of several programs each year, and based on informal observation since our data collection ended, we believe this trend continues.

A bar chart showing the number of new Anglophone DH programs each year from 1991 to 2015. A line showing the cumulative total of programs increases sharply at 2008.
Figure 1. Digital humanities programs in our collected data by year established

Program Titles

Most of the programs in our collected data (22, 59%) are titled simply “Digital Humanities,” along with a few variations, such as “Book History and Digital Humanities” and “Digital Humanities Research” (see Figure 2). A handful of programs are named for particular areas of DH or related topics (e.g., “Digital Culture,” “Public Scholarship”), and only a fraction (3 programs, 8%) are called “Humanities Computing.” We did not investigate changes in program names over time, although this might be worthwhile in the future.

A stacked bar chart comparing the titles of Anglophone DH programs. The segments that make up each bar are color coded by degree type (e.g., doctoral, master’s, bachelor’s, certificate, other).
Figure 2. Titles of digital humanities programs in our collected data

Structure

Less than half of DH programs in our collected data grant degrees: some at the level of bachelor’s (8%), most at the level of master’s (22%), and some at the doctoral (8%) level (Figure 3). The majority of DH programs are certificates, minors, specializations, and concentrations—certificates being much more common at the graduate level and nearly one-third of all programs in our collected data. The handful of doctoral programs are all located in the UK and Ireland.

A stacked bar chart showing the number of Anglophone DH programs at the undergraduate and graduate levels. The segments that make up each bar are color coded by degree type (e.g., doctoral, master’s, bachelor’s, certificate, other).
Figure 3. Digital humanities programs in our collected data (by degree and level)


In addition to degree-granting status, we also examined special requirements for the 37 DH programs in our study. Half of those programs require some form of independent research (see Figure 4). All doctoral programs require such research; most master’s programs do as well. Again, we only looked for cases of explicit requirements; it seems likely that research of some variety is conducted within all the programs analyzed here. However, we focus this study on explicit statements of academic activity in order to separate the assumptions of practitioners of DH about its activities from what appears in public-facing descriptions of the field.
Half of DH programs in our collected data require a final deliverable, referred to variously as a capstone, dissertation, portfolio, or thesis (see Figure 5). Again, discrepancies between written and unwritten expectations in degree programs abound—and are certainly not limited to DH—and some programs may have not explicitly stated this requirement, so deliverables may be undercounted. That said, most graduate programs require some kind of final deliverable, and most undergraduate and non-degree-granting programs (e.g., minors, specializations) do not.

Finally, about one-quarter of programs require fieldwork, often in the form of an internship (see Figure 6). This fieldwork requirement is spread across degree types and levels.

A stacked bar chart showing whether Anglophone DH programs require independent research as a part of their degree requirements. The segments that make up each bar are color coded by degree type (e.g., doctoral, master’s, bachelor’s, certificate, other).
Figure 4. Independent research requirements of digital humanities programs in our collected data


A stacked bar chart showing the final deliverable requirement (dissertation, portfolio, etc.) of Anglophone DH programs. The segments that make up each bar are color coded by degree type (e.g., doctoral, master’s, bachelor’s, certificate, other).
Figure 5. Final deliverable required by digital humanities programs in our collected data


A stacked bar chart showing whether Anglophone DH programs require fieldwork as a part of their degree requirements. The segments that make up each bar are color coded by degree type (e.g., doctoral, master’s, bachelor’s, certificate, other).
Figure 6. Fieldwork requirements of digital humanities programs in our collected data


Location and Disciplinarity

About one-third of the DH programs in our dataset are offered outside of academic schools/departments (in centers, initiatives, and, in one case, jointly with the library), and most issue from colleges/schools of arts and humanities (see Figure 7). Although much DH work occurs outside of traditional departments (Zorich 2008), formal training in Anglophone countries remains tied to them. Most DH concentrations and specializations are located within English departments, evidence for Kirschenbaum’s claim that DH’s “professional apparatus…is probably more rooted in English than any other departmental home” (2010, 55).

A bar chart showing location of Anglophone DH programs within an institution (college/school, center, department. etc.)
Figure 7. Institutional location of digital humanities programs in our collected data

The elective courses of DH programs span myriad departments and disciplines. The familiar humanities departments are well represented (art history, classics, history, philosophy, religion, and various languages), along with computer science, design, media, and technology. Several programs include electives drawn from education departments and information and library science. More surprising departments (and courses) include anthropology (“Anthropological Knowledge in the Museum”), geography (“Urban GIS”), political science (“New Media and Politics”), psychology (“Affective Interaction”), sociology (“Social and Historical Study of Information, Software, and Networks”), even criminology (“Cyber Crime”).

The number of electives required by each program and the pool from which they may be drawn varies greatly among programs, and in some cases it is so open-ended that it is nearly impossible to document thoroughly. Some programs have no elective courses and focus only on shared, required coursework. Others list dozens of potential elective courses as suggestions, rather than an exhaustive list. Because course offerings, especially in cross-disciplinary areas, change from term to term and different courses may be offered under a single, general course listing such as “Special Topics,” the list of elective course we have collected is only a sample of the type of courses students in DH programs may take, and we do not analyze them quantitatively here.

Theory and Critical Reflection

To analyze the role of theory and critical reflection in DH programs, we focused our analysis on two TaDiRAH terms: ‘Theorizing’,

a method which aims to relate a number of elements or ideas into a coherent system based on some general principles and capable of explaining relevant phenomena or observations. Theorizing relies on techniques such as reasoning, abstract thinking, conceptualizing and defining. A theory may be implemented in the form of a model, or a model may give rise to formulating a theory.

and ‘Meta: GiveOverview’, which

refers to the activity of providing information which is relatively general or provides a historical or systematic overview of a given topic. Nevertheless, it can be aimed at experts or beginners in a field, subfield or specialty.

In most cases, we used ‘Meta: GiveOverview’ to code theoretical or historical introductions to DH itself, though any explicit mention of theory was coded (or also coded) as ‘Theorizing’. We found that all DH programs, whether in program descriptions or required courses, included some mention of theory or historical/systematic overview (see Figure 8).

A table of Anglophone institutions and DH programs showing whether researchers coded ‘Theory’ or ‘GiveOverview’ for the program or required course descriptions.
Figure 8. Theory and critical reflection in digital humanities programs in our collected data

Accordingly, we might say that each program, according to its local interpretation, engages in some type of theoretical or critical reflection. We cannot, of course, say much more about the character of this reflection, whether it is the type of critical reflection called for in the pedagogical literature, or how this reflection interfaces with the teaching of skills and techniques in these programs. We hope someone studies this aspect of programs, but it is also worth noting that only 6 of the 37 programs here were coded for ‘Teaching/Learning’ (see Figure 12). Presumably, most programs do not engage theoretically with issues of pedagogy or the relationship between DH and higher education, commensurate with Brier’s claim that these areas are often overlooked (2012). Such engagement may occur in elective courses or perhaps nowhere in these programs.

European Programs

All of the 37 programs discussed above are located in Anglophone countries, most of them in the United States (22 programs, 60%). We note that TaDiRAH, too, originates in this context, as does our English-language web searches for DH programs. While this data is certainly in dialogue with the many discussions of DH education cited above, it limits what we can say about DH from a global perspective. It is important to understand the various ways DH manifests around the globe, both to raise awareness of these approaches and to compare the ways in which DH education converges and diverges across these contexts. To that end, we gathered existing data on European programs by scraping DARIAH’s Digital Humanities Course Registry (DARIAH-EU 2014a) and consulting the European Association for Digital Humanities’ (EADH) education resources webpage (2016). This DARIAH/EADH data is not intended to stand in for the entirety of global DH, as it looks exclusively at European programs (and even then it is limited in interpretation by our own language barriers). DH is happening outside of this scope (e.g., Gil 2017), and we hope that future initiatives can expand the conversation about DH programs worldwide—possibly as part of our plans for data publication, which we address at the end of this article.

DARIAH’s database lists 102 degree programs, 77 of which were flagged in page markup as “outdated” with the note, “This record has not been revised for a year or longer.” While inspecting DARIAH data, we found 43 programs tagged with TaDiRAH terms, and we eliminated 17 entries that were duplicates, had broken URLs and could not be located through a web search, or appeared to be single courses or events rather than formal programs. We also updated information on a few programs (e.g., specializations classified as degrees). We then added 5 programs listed by EADH but not by DARIAH, for a grand total of 93 European DH programs (only 16 of which were listed jointly by both organizations). We refer to this dataset as “DARIAH/EADH data” in the remainder of this paper. A map of these locations is provided in Figure 9, and the full list of programs considered in this paper is given in Appendices.

A map of Europe showing the number of DH programs in each country, based on DARIAH/EADH listings.
Figure 9. Geographic location of programs in DARIAH/EADH data


The DARIAH/EADH data lists 93 programs spread across parts of Europe, with the highest concentration (33%) in Germany (see Table 1). We caution here and in subsequent discussions that DARIAH and EADH may not have applied the same criteria for including programs as we did in our data collection, so results are not directly comparable. Some programs in informatics or data asset management might have been ruled out using our data collection methods, which were focused on humanities content.

Table 1. Summary of programs included in our collected data and DARIAH/EADH data
Country Programs in our collected data
N (%)
Programs in DARIAH/EADH data
N (%)
Australia 1 (3%)
Austria 1 (1%)
Belgium 2 (2%)
Canada 6 (16%)
Croatia 3 (3%)
Finland 1 (1%)
France 8 (9%)
Germany 31 (33%)
Ireland 3 (8%) 4 (4%)
Italy 4 94%)
Netherlands 16 (17%)
Norway 1 (1%)
Portugal 1 (1%)
Spain 2 (2%)
Sweden 1 (1%)
Switzerland 6 (7%)
United Kingdom 5 (14%) 12 (13%)
United States 22 (60%)

Program Titles

A cursory examination of the DARIAH/EADH program title reveals more variety, including many programs in computer linguistics and informatics (see Appendix B). We did not analyze these titles further because of language barriers. And again, we caution that some of these programs might not have been included according to the criteria for our study, though the vast majority appear relevant.

Structure

Most programs in the DARIAH/EADH data are degree-granting at the level of master’s (61%) or bachelor’s (25%) (see Figure 10). While we are reasonably confident in these broad trends, we are skeptical of the exact totals for two reasons. In DARIAH’s Registry, we noticed several cases of specializations being labeled as degrees. Though we rectified these cases where possible, language barriers prevented us from more thoroughly researching each program—another challenge that a global study of DH would encounter. On the other hand, it’s also possible that non-degree programs were undercounted in general, given that the Registry was meant to list degrees and courses. Based on our inspection of each program, we do not believe these errors are widespread enough to change the general distribution of the data: more European programs issue degrees, mostly at the master’s level.

A stacked bar chart showing the number of European DH programs at the undergraduate and graduate levels, as listed by DARIAH/EADH. The segments that make up each bar are color coded by degree type (e.g., doctoral, master’s, bachelor’s, certificate, other).
Figure 10. Digital humanities programs (by degree and level, DARIAH/EADH data)

Location and Disciplinarity

Most European programs are also located in academic divisions called colleges, departments, faculties, or schools (see Figure 11), depending on country. Only a handful of programs are located in institutes, centres, or labs, even less frequently than in our collected data.

A bar chart showing location of European DH programs within an institution (college/department/faculty/school, centre, institute. etc.), as listed by DARIAH/EADH.
Figure 11. Institutional location of digital humanities programs (DARIAH/EADH data)

We did not analyze disciplinarity in the DARIAH/EADH data because the programs span various countries, education systems, and languages—things we could not feasibly study here. However, 43 programs in the DARIAH/EADH data were tagged with TaDiRAH terms, allowing for comparison with programs in our collected data. These speak to what happens in DH programs in Europe, even if their disciplinary boundaries vary.

DH Activities

To analyze the skills and methods at play in DH programs, we examined our TaDiRAH codings in terms of overall term frequency (see Figure 12) and weighted frequency across individual programs (see Figures 13 and 14). Several trends were apparent in our codings, as well as DARIAH-listed programs that were also tagged with TaDiRAH terms.

In our data on Anglophone programs of DH programs, analysis and meta-activities (e.g., ‘Community building’, ‘Project management’, ‘Teaching/Learning’) make up the largest share of activities, along with creation (e.g., ‘Designing’, ‘Programming’, ‘Writing’). This is apparent in absolute term frequencies (see Figure 12, excepting ‘Theorizing’ and ‘Meta: GiveOverview’) and in a heatmap comparison of programs (see Figure 13). Again, the heatmap used weighted frequencies to adjust for the fact that some areas have few terms, while others have more than double the smallest. It is worth noting that ‘Writing’ is one of the most frequent terms (11 programs), but this activity certainly occurs elsewhere and is probably undercounted because it was not explicitly mentioned in program descriptions. The same may be true for other activities.

A series of bar charts showing the number of times each TaDiRAH term appeared in the datasets. Terms are listed under their parent terms, and subtotals are given for each parent term. Data collected by researchers (Anglophone programs) are displayed in blue, and DARIAH data are displayed in orange.
Figure 12. TaDiRAH term coding frequency (grouped)


A heatmap of Anglophone DH programs and TaDiRAH parent terms. The saturation of each cell shows the number of times that terms within that parent term were coded for that particular program, whether in program descriptions or course descriptions.
Figure 13. Digital humanities programs in our collected data and their required courses (by area)

Many program specializations seem to follow from the flavor of DH at particular institutions (e.g. the graduate certificate at Stanford’s Center for Spatial and Textual Analysis, University of Iowa’s emphasis on public engagement), commensurate with Knight’s (2011) call for “localization” in DH.

In contrast with the most frequent terms, some terms were never applied to program/course descriptions in our data, including ‘Translation’, ‘Cleanup’, ‘Editing’, and ‘Identifying’. Enrichment and storage activities (e.g., ‘Archiving’, ‘Organizing’, ‘Preservation’) were generally sparse (only 1.9% of all codings), even after compensating for the fact that these areas have fewer terms. We suspect that these activities do occur in DH programs and courses—in fact, they are assumed in broader activities such as thematic research collections, content management systems, and even dissemination. Their lack of inclusion in program/course descriptions seems constituent with claims made by librarians that their expertise in technology, information organization, and scholarly communication is undervalued in the field, whether instrumentalized as part a service model that excludes them from the academic rewards of and critical decision-making in DH work (Muñoz 2013; Posner 2013) or devalued as a form of feminized labor (Shirazi 2014). Ironically, these abilities are regarded as qualifications for academic librarian positions and as marketable job skills for humanities students and, at the same time, as a lesser form of academic work, often referred to as faculty “service” (Nowviskie 2012; Sample 2013; Takats 2013). We suspect that many program descriptions replicate this disconnect by de-emphasizing some activities (e.g., storage, enrichment) over others (e.g., analysis, project management).

Generally, there seems to be less emphasis on content (‘Capture’, ‘Enrichment’, and ‘Storage’ terms) and more focus on platforms and tools (‘Analysis’ and ‘Meta-Activities’ terms) within programs in our collected data. In interpreting this disparity, we think it’s important to attend to the larger contexts surrounding education in various locations. The Anglophone programs we studied are mostly located in the United States, where “big data” drives many decisions, including those surrounding higher education. As boyd and Crawford note, this phenomenon rests on the interplay of technology, analysis, and “[m]ythology: the widespread belief that large data sets offer a higher form of intelligence and knowledge that can generate insights that were previously impossible, with the aura of truth, objectivity, and accuracy” (2013: 663). Within this context, programs advertising analysis, visualization, and project management may appear as more attractive to prospective students and supporting institutions, two important audiences of program webpages. This influence does not mean that such activities do not occur or are not important to DH, but it again turns attention to questions about the way in which these skills are developed and deployed and whether that occurs against a backdrop of critical reflection on methods and tools. How these broad program-level descriptions play out in the context of particular courses and instruction is beyond the scope of this program-level study, but we think that surfacing the way programs are described is an important first step to a deeper analysis of these questions.

When comparing our 37 programs to the 43 TaDiRAH-tagged European ones, several differences emerge—though we caution that these findings, in particular, may be less reliable than others presented here. In our study, we coded for guaranteed activities, explicit either in program descriptions or required course description. In DARIAH’s Registry, entries are submitted by users, who are given a link to another version of TaDiRAH (2014b) and instructed to code at least one activities keyword (DARIAH-EU 2014b). We do not know the criteria each submitter uses for applying terms, and it’s likely that intercoder agreement would be low in absence of pre-coordination. For example, programs in the Netherlands are noticeably sparser in their codings than programs elsewhere—perhaps submitted by the same coder, or coders with a shared understanding and different from the others (see Figure 14).

A heatmap of DH programs and TaDiRAH parent terms, as listed by DARIAH. The saturation of each cell shows the number of times that terms within that parent term were coded for that particular program.
Figure 14. Digital humanities programs (by area, TaDiRAH-tagged subset of DARIAH data)

We tried to compare directly our codings with DARIAH data by looking at five programs listed in common. Only one of these programs had TaDiRAH terms in DARIAH data: specifically, all eight top-level terms. When examining other programs, we found several tagged with more than half of the top-level terms and one tagged with 40 of 48 activities terms. These examples alone suggest that DARIAH data may be maximally inclusive in its TaDiRAH codings. Nevertheless, we can treat this crowdsourced data as reflective of broad trends in the area and compare them, generally, to those found in our study. Moreover, there does not appear to be any geographic or degree-based bias in the DARIAH data: the 43 tagged programs span ten different countries and both graduate and undergraduate offerings, degree and non-degree programs.

Comparing term frequencies in our collected data and DARIAH/EADH data (see Figure 12), it appears that enrichment, capture, and storage activities are more prevalent in European programs, while analysis and meta-activities are relatively less common (see Table 2). While both datasets have roughly the same number of programs (37 and 43, respectively), the DARIAH data has over twice as many terms as our study. For this reason, we computed a relative expression of difference by dividing the total percent of a TaDiRAH area in DARIAH data by the total percent in our study. Viewed this way, ‘Enrichment’ has over five times as many weighted codings in DARIAH as our study, followed by ‘Capture’ with over twice as many; ‘Analysis’, ‘Interpretation’, and ‘Meta-activities’ are less common. Thus, Anglophone and European programs appear to focus on different areas, within the limitations mentioned above and while still overlapping in most areas. This difference might be caused by the inclusion of more programs related to informatics, digital asset management, and communication in the DARIAH data than in our collected data, or the presence of more extensive cultural heritage materials, support for them, and integration into European programs. At a deeper level, this difference may reflect a different way of thinking or talking about DH or the histories of European programs, many of which were established before programs in our collected data.

Table 2. Summary of TaDiRAH term coding frequencies (grouped)
TaDiRAH parent term (includes subterms) In our collected data
N (%)
In DARIAH
N (%)
Factor of difference overall (weighted)
Capture 13 (6.1%) 73 (15.7%) 5.6 (2.55)
Creation 35 (16.5%) 74 (15.9%) 2.1 (0.96%)
Enrichment 4 (1.9%) 48 (10.3%) 12.0 (5.46)
Analysis 47 (22.2%) 77 (16.5%) 1.6 (0.75)
Interpretation 27 (12.7%) 40 (8.6%) 1.5 (0.67)
Storage 11 (5.2%) 43 (9.2%) 3.9 (1.78)
Dissemination 24 (11.3%) 63 (13.5%) 2.6 (1.19)
Meta-Activities 51 (24.1%) 48 (10.3%) 0.9 (0.43)

Reflections on TaDiRAH

Since TaDiRAH aims to be comprehensive of the field—even machine readable—we believe our challenges applying it may prove instructive to revising the taxonomy for wider application and for considering how DH is described more generally.
Most examples of hard-to-code language were technical (e.g., databases, content management systems, CSS, and XML) and blurred the lines between capture, creation, and storage and, at a narrower level, web development and programming. Given the rate at which technologies change, it may be difficult to come up with stable terms for DH. At the same time, we may need to recognize that some of the most ubiquitous technologies and platforms in the field (e.g., Omeka, WordPress) actually subsume over various activities and require myriad skills. This, in turn, might give attention to skills such as knowledge organization, which seem rarely taught or mentioned on an explicit basis.

A separate set of hard-to-code activities included gaming and user experience (UX). We suspect the list might grow as tangential fields intersect with DH. Arguably, UX falls under ‘Meta: Assessing’, but there are design and web development aspects of UX that distinguish it from other forms of assessment, aspects that probably belong better with ‘Creation’. Similarly, gaming might be encompassed by ‘Meta: Teaching/Learning’, which

involves one group of people interactively helping another group of people acquire and/or develop skills, competencies, and knowledge that lets them solve problems in a specific area of research,

but this broad definition omits distinctive aspects of gaming, such as play and enjoyment, that are central to the concept. Gaming and UX, much like the technical cases discussed earlier, draw on a range of different disciplines and methods, making them difficult to classify. Nevertheless, they appear in fieldwork and are even taught in certain programs/courses, making it important to represent them in the taxonomy of DH.

With these examples in mind and considering the constantly evolving nature of DH and the language that surrounds it, it is difficult and perhaps counterproductive to suggest any concrete changes to TaDiRAH that would better represent the activities involved in “doing DH.” We present these findings as an empirical representation of what DH in certain parts of the world looks like now, with the hope that it will garner critical reflection from DH practitioners and teachers about how the next generation of students perceives our field and the skills that are taught and valued within it.

Conclusion and Further Directions

Our survey of DH programs in the Anglophone world may be summarized by the following points.

  • The majority of Anglophone programs are not degree-granting; they are certificates, minors, specializations, and concentrations. By comparison, most European programs are degree-granting, often at the master’s level.
  • About half of Anglophone programs require some form of independent research, and half require a final deliverable, referred to variously as a capstone, dissertation, portfolio, or thesis. About one-quarter of programs require fieldwork, often in the form of an internship.
  • About one-third of Anglophone DH programs are offered outside of academic schools/departments (in centers, initiatives, and, in one case, jointly with the library). By comparison, most European programs are located in academic divisions; only a handful are offered in institutes, centres, or labs.
  • Analysis and meta-activities (e.g., community building, project management) make up the largest share of activities in Anglophone programs, along with creation (e.g., designing, programming, writing). By contrast, activities such as enrichment, capture, and storage seem more prevalent in European programs. Some of these areas may be over- or under-represented for various cultural reasons we’ve discussed above.

As with any survey, there may be things uncounted, undercounted, or miscounted, and we have tried to note these limitations throughout this article.

One immediate application of this data is a resource for prospective students and those planning and revising formal programs. At minimum, this data provides general information about these 37 programs, along with some indication of special areas of emphasis—a compliment to DARIAH/EADH data. As we discussed earlier, this list should be more inclusive of DH throughout the globe, and that probably requires an international team fluent in the various languages of the programs. Following our inspection of DARIAH’s Registry, we believe it’s difficult to control the accuracy of such data in a centralized way. To address both of these challenges, we believe that updates to this data are best managed by the DH community, and to that end, we have created a GitHub repository at https://github.com/dhprograms/data where updates can be forked and pulled into a master branch. This branch will be connected to Tableau Public for live versions of visualizations similar to the ones included here. Beyond this technical infrastructure, our next steps include outreach to the community to ensure that listings are updated and inclusive in ways that go beyond our resources in this study.

Second, there are possibilities for studying program change over time using the archive of program webpages and course descriptions generated by this study. Capture of program and course information in the future might allow exploration of the growth of the field as well as changes in its activities. We believe that a different taxonomy or classification system might prove useful here, as well as a different method of coding. These are active considerations as we build the GitHub repository. We also note that this study may induce some effect (hopefully positive) in the way that programs and courses are described, perhaps pushing them to be more explicit about the nature and extent of DH activities.

Finally, we hope this study gives the community pause to consider how DH is described and represented, and how it is taught. If there are common expectations not reflected here, perhaps DHers could be more explicit about how we, as a community, describe the activities that make up DH work, at least in building our taxonomies and describing our formal programs and required courses. Conversely, if there are activities that seem overrepresented here, we might consider why those activities are prized in the field (and which are not) and whether this is the picture we wish to present publicly. We might further consider this picture in relationship to the cultural and political-economic contexts in which DH actually exists. Are we engaging with these larger structures? Do the activities of the field reflect this? Is it found in our teaching and learning, and in the ways that we describe those?

Acknowledgements

We are grateful to Allison Piazza for collecting initial data about some programs, as well as Craig MacDonald for advice on statistical analysis and coding methods. Attendees at the inaugural Keystone Digital Humanities Conference at the University of Pennsylvania Libraries provided helpful feedback on the ideas presented here. JITP reviewers Stewart Varner and Kathi Berens were helpful interlocutors for this draft, as were anonymous reviewers of a DH2017 conference proposal based on this work.

Bibliography

Alexander, Bryan and Rebecca Frost Davis. 2012. “Should Liberal Arts Campuses Do Digital Humanities? Process and Products in the Small College World.” In In Debates in the Digital Humanities, edited by Matthew K. Gold. Minneapolis: University Of Minnesota Press. Retrieved from http://dhdebates.gc.cuny.edu/debates/text/25.

boyd, danah and Kate Crawford. 2013. “Critical Questions for Big Data.” Information, Communication & Society 15(5): 662–79. Retrieved from http://dx.doi.org/10.1080/1369118X.2012.678878.

Brennan, Sheila A. 2016. “Public, First.” In Debates in the Digital Humanities, edited by Matthew K. Gold and Lauren F. Klein. Minneapolis: University of Minnesota Press. Retrieved from http://dhdebates.gc.cuny.edu/debates/text/83.

Brier, Stephen. 2012. “Where’s the Pedagogy? The Role of Teaching and Learning in the Digital Humanities.” In Debates in the Digital Humanities, edited by Matthew K. Gold, 390–401. Minneapolis: University Of Minnesota Press. Retrieved from http://dhdebates.gc.cuny.edu/debates/text/8.

Buurma, Rachel Sagner and Anna Tione Levine. “The Sympathetic Research Imagination: Digital Humanities and the Liberal Arts.” In Debates in the Digital Humanities, edited by Matthew K. Gold and Lauren F. Klein. Minneapolis: University of Minnesota Press. Retrieved from http://dhdebates.gc.cuny.edu/debates/text/74.

Clement, Tanya. 2012. “Multiliteracies in the Undergraduate Digital Humanities Curriculum.” In Digital Humanities Pedagogy: Practices, Principles and Politics, edited by Brett D. Hirsch, 365–88. Open Book Publishers. Retrieved from http://www.openbookpublishers.com/product/161/digital-humanities-pedagogy–practices–principles-and-politics.

———. 2015. “Digital Humanities Inflected Undergraduate Programs.” Tanyaclement.org. January 8, 2015. Retrieved from http://tanyaclement.org/2009/11/04/digital-humanities-inflected-undergraduate-programs-2.

DARIAH-EU. 2014a. “Digital Humanities Course Registry.” https://dh-registry.de.dariah.eu.

———. 2014b. “Manual and FAQ.” Digital Humanities Course Registry. Retrieved from https://dh-registry.de.dariah.eu/pages/manual.

“DiRT Directory.” 2014. Retrieved from http://dirtdirectory.org.

“Doing Digital Humanities – A DARIAH Bibliography.” 2014. Zotero. Retrieved from https://www.zotero.org/groups/doing_digital_humanities_-_a_dariah_bibliography/items/order/creator/sort/asc.

Dombrowski, Quinn, and Jody Perkins. 2014. “TaDiRAH: Building Capacity for Integrated Access.” dh+lib. May 21, 2014. Retrieved from http://acrl.ala.org/dh/2014/05/21/tadirah-building-capacity-integrated-access.

Drucker, Johanna, John Unsworth, and Andrea Laue. 2002. “Final Report for Digital Humanities Curriculum Seminar.” Media Studies Program, College of Arts and Science: University of Virginia. Retrieved from http://www.iath.virginia.edu/hcs/dhcs.

European Association for Digital Humanities. 2016. “Education.” February 1, 2016. Retrieved from http://eadh.org/education.

Gil, Alex. “DH Organizations around the World.” Retrieved from http://testing.elotroalex.com/dhorgs. Accessed 10 Apr 2017.

Grandjean, Martin. 2014a. “The Digital Humanities Network on Twitter (#DH2014).” Martin Grandjean. July 14. Retrieved from http://www.martingrandjean.ch/dataviz-digital-humanities-twitter-dh2014.

———. 2014b. “The Digital Humanities Network on Twitter: Following or Being Followed?” Martin Grandjean. September 8. Retrieved from http://www.martingrandjean.ch/digital-humanities-network-twitter-following.

———. 2015. “Digital Humanities on Twitter, a Small-World?” Martin Grandjean. July 2. Retrieved from http://www.martingrandjean.ch/digital-humanities-on-twitter.

Hockey, Susan. 1986. “Workshop on Teaching Computers and Humanities Courses.” Literary & Linguistic Computing 1(4): 228–29.

———. 2001. “Towards a Curriculum for Humanities Computing: Theoretical Goals and Practical Outcomes.” The Humanities Computing Curriculum / The Computing Curriculum in the Arts and Humanities Conference. Malaspina University College, Nanaimo, British Columbia.

Hsu, Wendy F. 2016. “Lessons on Public Humanities from the Civic Sphere.” In Debates in the Digital Humanities, edited by Matthew K. Gold and Lauren F. Klein. Minneapolis: University of Minnesota Press. Retrieved from http://dhdebates.gc.cuny.edu/debates/part/13.

Kirschenbaum, Matthew G. 2010. “What Is Digital Humanities and What’s It Doing in English Departments?” ADE Bulletin 150: 55–61.

Knight, Kim. 2011. “The Institution(alization) of Digital Humanities.” Modern Language Association Conference 2011. Los Angeles. Retrieved from http://kimknight.com/?p=801.

Liu, Alan. 2012. “Where Is Cultural Criticism in the Digital Humanities?” In Debates in the Digital Humanities, edited by Matthew K. Gold, 490–509. Minneapolis, Minn.: University Of Minnesota Press. Retrieved from http://dhdebates.gc.cuny.edu/debates/text/20.

Mahony, Simon, and Elena Pierazzo. 2012. “Teaching Skills or Teaching Methodology.” In Digital Humanities Pedagogy: Practices, Principles and Politics, edited by Brett D. Hirsch, 215–25. Open Book Publishers. Retrieved from http://www.openbookpublishers.com/product/161/digital-humanities-pedagogy–practices–principles-and-politics.

McCarty, Willard. 2012. “The PhD in Digital Humanities.” In Digital Humanities Pedagogy: Practices, Principles and Politics, edited by Brett D. Hirsch. Open Book Publishers. Retrieved from http://www.openbookpublishers.com/product/161/digital-humanities-pedagogy–practices–principles-and-politics.

McGrail, Anne B. 2016 “The ‘Whole Game’: Digital Humanities at Community Colleges.” In Debates in the Digital Humanities, edited by Matthew K. Gold and Lauren F. Klein. Minneapolis: University of Minnesota Press. Retrieved from http://dhdebates.gc.cuny.edu/debates/text/53

Mowitt, John. 2012. “The Humanities and the University in Ruin.” Lateral 1. Retrieved from http://csalateral.org/issue1/content/mowitt.html

Muñoz, Trevor. 2013. “In Service? A Further Provocation on Digital Humanities Research in Libraries.” dh+lib. Retrieved from http://acrl.ala.org/dh/2013/06/19/in-service-a-further-provocation-on-digital-humanities-research-in-libraries.

“NeDiMAH Methods Ontology: NeMO.” 2015. Retrieved from http://www.nedimah.eu/content/nedimah-methods-ontology-nemo.

Nowviski, Bethany. 2012. “Evaluating Collaborative Digital Scholarship (or, Where Credit is Due).” Journal of Digital Humanities 1(4). Retrieved from http://journalofdigitalhumanities.org/1-4/evaluating-collaborative-digital-scholarship-by-bethany-nowviskie.

Perkins, Jody, Quinn Dombrowski, Luise Borek, and Christof Schöch. 2014. “Project Report: Building Bridges to the Future of a Distributed Network: From DiRT Categories to TaDiRAH, a Methods Taxonomy for Digital Humanities.” In Proceedings of the International Conference on Dublin Core and Metadata Applications 2014, 181–83. Austin, Texas.

Posner, Miriam. 2013. “No Half Measures: Overcoming Common Challenges to Doing Digital Humanities in the Library.” Journal of Library Administration 53(1): 43–52. UCLA: 10.1080/01930826.2013.756694. Retrieved from http://www.escholarship.org/uc/item/6q2625np.

Prescott, Andrew. 2016. “Beyond the Digital Humanities Center: The Administrative Landscapes of the Digital Humanities.” In A New Companion to Digital Humanities, 2nd ed., 461–76. Wiley-Blackwell.

Quan-Haase, Anabel, Kim Martin, and Lori McCay-Peet. 2015. “Networks of Digital Humanities Scholars: The Informational and Social Uses and Gratifications of Twitter.” Big Data & Society 2(1): 2053951715589417. doi:10.1177/2053951715589417.

Rockwell, Geoffrey. 1999. “Is Humanities Computing and Academic Discipline?” presented at An Interdisciplinary Seminar Series, Institute for Advanced Technology in the Humanities, University of Virginia, November 12.

Rosenblum, Brian, Frances Devlin, Tami Albin, and Wade Garrison. 2016. “Collaboration and CoTeaching Librarians Teaching Digital Humanities in the Classroom.” In Digital Humanities in the Library: Challenges and Opportunities for Subject Specialists, edited by Arianne Hartsell-Gundy, Laura Braunstein, and Liorah Golomb, 151–75. Association of College and Research Libraries.

Ross, Claire, Melissa Terras, Claire Warwick, and Anne Welsh. 2011. “Enabled Backchannel: Conference Twitter Use by Digital Humanists.” Journal of Documentation 67(2): 214–37. doi:10.1108/00220411111109449.

Sample, Mark. 2013. “When does Service become Scholarship?” [web log]. Retrieved from http://www.samplereality.com/2013/02/08/when-does-service-become-scholarship.

Selisker, Scott. 2016. “Digital Humanities Knowledge: Reflections on the Introductory Graduate Syllabus. In Debates in the Digital Humanities, edited by Matthew K. Gold and Lauren F. Klein. Minneapolis: University of Minnesota Press. Retrieved from http://dhdebates.gc.cuny.edu/debates/text/68.

Senchyne, Jonathan. 2016. “Between Knowledge and Metaknowledge: Shifting Disciplinary Borders in Digital Humanities and Library and Information Studies.” In Debates in the Digital Humanities, edited by Matthew K. Gold and Lauren F. Klein. Minneapolis: University of Minnesota Press. Retrieved from http://dhdebates.gc.cuny.edu/debates/text/81.

Shirazi, Roxanne. 2014. “Reproducing the Academy: Librarians and the Question of Service in the Digital Humanities.” Association for College and Research Libraries, Annual Conference and Exhibition of the American Library Association. Las Vegas, Nev. Retrieved from http://roxanneshirazi.com/2014/07/15/reproducing-the-academy-librarians-and-the-question-of-service-in-the-digital-humanities.

Siemens, Ray. 2001. “The Humanities Computing Curriculum / The Computing Curriculum in the Arts and Humanities: Presenters and Presentation Abstracts.” November 9–10, 2001. Retrieved from https://web.archive.org/web/20051220181036/http://web.mala.bc.ca/siemensr/HCCurriculum/abstracts.htm#Hockey.

Sinclair, Stefan. 2001. “Report from the Humanities Computing Curriculum Conference,” Humanist Discussion Group. November 16, 2001. Retrieved from http://dhhumanist.org/Archives/Virginia/v15/0351.html.

Sinclair, Stèfan, and Sean W. Gouglas. 2002. “Theory into Practice A Case Study of the Humanities Computing Master of Arts Programme at the University of Alberta.” Arts and Humanities in Higher Education 1(2): 167–83. doi:10.1177/1474022202001002004.

Smith, David. 2014. “Advocating for a Digital Humanities Curriculum: Design and Implementation.” Presented at Digital Humanities 2014. Lausanne, Switzerland. Retrieved from http://dharchive.org/paper/DH2014/Paper-665.xml.

Spiro, Lisa. 2011. “Knowing and Doing: Understanding the Digital Humanities Curriculum.” Presented at Digital Humanities 2011. Stanford University.

TaDiRAH. 2014a. “TaDiRAH – Taxonomy of Digital Research Activities in the Humanities.” GitHub. May 13, 2014. Retrieved from https://github.com/dhtaxonomy/TaDiRAH.

———. 2014b. “TaDiRAH – Taxonomy of Digital Research Activities in the Humanities.” July 18, 2014. Retrieved from http://tadirah.dariah.eu/vocab/index.php.
Takats, Sean. 2013. “A Digital Humanities Tenure Case, Part 2: Letters and Committees.” [web log]. Retrieved from http://quintessenceofham.org/2013/02/07/a-digital-humanities-tenure-case-part-2-letters-and-committees.

Terras, Melissa. 2006. “Disciplined: Using Educational Studies to Analyse ‘Humanities Computing.’” Literary and Linguistic Computing 21(2): 229–46. doi:10.1093/llc/fql022.

Terras, Melissa, Julianne Nyhan, and Edward Vanhoutte. 2013. Defining Digital Humanities: A Reader. Ashgate Publishing, Ltd.

UCLA Center for Digital Humanities. 2015. “Digital Humanities Programs and Organizations.” January 8, 2015. Retrieved from https://web.archive.org/web/20150108203540/http://www.cdh.ucla.edu/resources/us-dh-academic-programs.html.

Unsworth, John. 2000. “Scholarly Primitives: What Methods Do Humanities Researchers Have in Common, and How Might Our Tools Reflect This?” Presented at Symposium on Humanities Computing: Formal Methods, Experimental Practice, King’s College London. Retrieved from http://people.brandeis.edu/~unsworth/Kings.5-00/primitives.html.

———. 2001. “A Masters Degree in Digital Humanities at the University of Virginia.” Presented at 2001 Congress of the Social Sciences and Humanities. Université Laval, Québec, Canada. Retrieved from http://www3.isrl.illinois.edu/~unsworth/laval.html.

Unsworth, John, and Terry Butler. 2001. “A Masters Degree in Digital Humanities at the University of Virginia.” Presented at ACH-ALLC 2001, New York University, June 13–16, 2001.

Varner, Stuart. 2016. “Library Instruction for Digital Humanities Pedagogy in Undergraduate Classes.” In Laying the Foundation: Digital Humanities in Academic Libraries, edited by John W. White and Heather Gilbert, 205–22. Notre Dame, Ind: Purdue University Press.

Vedantham, Anu and Dot Porter. 2016. “Spaces, Skills, and Synthesis.” In Digital Humanities in the Library: Challenges and Opportunities for Subject Specialists, edited by Arianne Hartsell-Gundy, Laura Braunstein, and Liorah Golomb, 177–98. Association of College and Research Libraries.

Waltzer, Luke. 2012. “Digital Humanities and the ‘Ugly Stepchildren’ of American Higher Education.” In Debates in the Digital Humanities, edited by Matthew K. Gold, 335–49. Minneapolis: University Of Minnesota Press. Retrieved from http://dhdebates.gc.cuny.edu/debates/text/33.

Weingart, Scott. 2016. “dhconf.” the scottbot irregular. Accessed March 1, 2016. Retrieved from http://www.scottbot.net/HIAL/?tag=dhconf.

Zorich, D. 2008. A Survey of Digital Humanities Centers in the United States. Council on Library and Information Resources.

Appendix A

List of Digital Humanities Programs in our Collected Data

  • Minor (undergraduate) in Digital Humanities, Australian National University
  • Minor (undergraduate) in Digital Humanities & Technology, Brigham Young University
  • Minor (undergraduate) in Interactive Arts and Science, Brock University
  • BA in Interactive Arts and Science, Brock University
  • MA in Digital Humanities (Collaborative Master’s), Carleton University
  • MA (program track) in Digital Humanities, CUNY Graduate Center
  • Minor (undergraduate) in Digital Humanities, Farleigh Dickinson University
  • BS in Digital Humanities, Illinois Institute of Technology
  • MPhil/PhD in Digital Humanities Research, King’s College London
  • MA in Digital Humanities, King’s College London
  • BA in Digital Culture, King’s College London
  • MA in Digital Humanities, Loyola University Chicago
  • Certificate (graduate) in Digital Humanities, Michigan State University
  • Specialization (undergraduate) in Digital Humanities, Michigan State University
  • MA in Digital Humanities, National University of Ireland Maynooth
  • PhD in Digital Arts and Humanities, National University of Ireland Maynooth
  • Certificate (graduate) in Digital Humanities, North Carolina State University
  • Certificate (graduate) in Digital Humanities, Pratt Institute
  • Certificate in Digital Humanities, Rutgers University
  • Certificate (graduate) in Digital Humanities, Stanford University
  • Certificate (graduate) in Digital Humanities, Texas A&M University
  • Certificate (graduate) in Book History and Digital Humanities, Texas Tech University
  • MPhil in Digital Humanities and Culture, Trinity College Dublin
  • Certificate (graduate) in Digital Humanities, UCLA
  • Minor (undergraduate) in Digital Humanities, UCLA
  • MA/MSc in Digital Humanities, University College London
  • PhD in Digital Humanities, University College London
  • MA in Humanities Computing, University of Alberta
  • Specialization (undergraduate) in Literature & the Culture of Information, University of California, Santa Barbara
  • Concentration (graduate) in Humanities Computing, University of Georgia
  • Concentration (undergraduate) in Humanities Computing, University of Georgia
  • Certificate (graduate) in Public Digital Humanities, University of Iowa
  • Certificate (graduate) in Digital Humanities, University of Nebraska-Lincoln
  • Certificate (graduate) in Digital Humanities, University of North Carolina at Chapel Hill
  • Certificate (graduate) in Digital Humanities, University of Victoria
  • Certificate (graduate) in Certificate in Public Scholarship, University of Washington
  • Minor (undergraduate) in Digital Humanities, Western University Canada

Appendix B

List of Programs in DARIAH/EADH Data

A table of European institutions and DH programs. For each program, the type (e.g., Bachelor’s, Master’s) is listed, as well as whether the program was listed by DARIAH, EADH, or both.
Figure 15: European institutions and DH programs

Appendix C

Data

In addition to creating a GitHub repository at https://github.com/dhprograms/data, we include the program data we collected and our term codings below. Since the GitHub data may be updated over time, these files serve as the version of record for the data and analysis presented in this article.

Data for “A Survey of Digital Humanities Programs”

About the Authors

Chris Alen Sula is Associate Professor and Coordinator of Digital Humanities and the MS in Data Analytics & Visualization at Pratt Institute School of Information. His research applies visualization to humanities datasets, as well as exploring the ethics of data and visualization. He received his PhD in Philosophy from the City University of New York with a doctoral certificate in Interactive Technology and Pedagogy.

S.E. Hackney is a PhD student in Library and Information Science at the University of Pittsburgh. Their research looks at the documentation practices of online communities, and how identity, ideology, and the body get represented through the governance of digital spaces. They received their MSLIS with an Advanced Certificate in Digital Humanities from Pratt Institute School of Information in 2016.

Phillip Cunningham has been a reference assistant and cataloger with the Amistad Research Center since 2015. He received a BA in History from Kansas State University and MSLIS from Pratt Institute. He has interned at the Schomburg Center’s Jean Blackwell Hutson Research and Reference Division, the Gilder-Lehrman Institute for American History, and the Riley County (KS) Genealogical Society. His research has focused on local history, Kansas African-American history, and the use of digital humanities in public history.

1

Practicing Digital Literacy in the Liberal Arts: A Qualitative Analysis of Students’ Online Research Journals

Abstract

How can we use digital technologies and pedagogies to foster students’ development as digitally literate researchers? We examine an undergraduate course on new information technologies for which we developed a research journal assignment aimed to develop students’ digital literacies. We conducted a qualitative analysis of students’ research journals as they investigated global internet censorship. Our study contributes to growing interest in digital literacies and how to shape learning opportunities to promote students’ identities as digitally literate researchers and citizens.

Introduction

Information pollution, information overload, and infoglut are some of the most common terms used to describe the “almost infinite abundance” and “surging volume” of information that “floods” and “swamps” us daily (Hemp 2009). Popular media articles appear regularly offering tips and strategies to “cope with,” “conquer,” and even “recover” from information overload (e.g., Harness 2015; Shin 2014; Tattersall 2015). Information Fatigue Syndrome, a term coined in 1996, refers to the stress and exhaustion caused by a constant bombardment of data (Vulliamy 1996). In Data Smog: Surviving the Information Glut, David Shenk (1997) argues that the surplus of information doesn’t enhance our lives, but instead undermines and overwhelms us to the point of anxiety and indecision. According to research conducted by Project Information Literacy researchers, “it turns out that students are poorly trained in college to effectively navigate the internet’s indiscriminate glut of information” (Head and Wihbey 2014, para. 7).

The study presented here emerged from “New Information Technologies,” an undergraduate course in the media and communication department at a small, private, liberal arts college in the northeast United States. The course introduced students to key concepts and tools for thinking critically about new information technology and what it means to live in a digital, global society. Course goals underscored the importance of developing students’ capacities as digitally literate learners and citizens of a global network society. We intentionally articulated course learning goals around both the content area and the practices of digital literacy embedded in course assignments. We asked students to reflectively discover, organize, analyze, create, and share information using digital tools. Our aim was to empower students with the tools and abilities to thrive in the information ecosystem as both consumers and producers, rather than flounder in information overload. We wanted students to experience research as active agents driving the process through their choices and attitudes. With these broad framing objectives in mind, we developed a multiphase research assignment called the Internet Censorship Project.

In this article, we detail our collaborative development of the Internet Censorship Project assignment and discuss a qualitative analysis of the resulting student work. In our analysis, we focus in particular on students’ engagement in and reflection on the research process and their agency and identity therein. Our close look at the assignment and student learning offers an opportunity to consider the possibilities of integrating digital tools and pedagogies to deepen students’ digital literacy in the context of liberal arts education.

Collaborating for Digital Literacy

This course provided ideal opportunities for collaboration between an information literacy librarian and a media and communication professor with shared interests in digital literacy. Our respective disciplines have a common concern for digital literacy, although we often describe and approach the concept in distinct ways. The library and information science field typically uses the term “information literacy,” while media and communication studies uses “media literacy.” The Association of College and Research Libraries (2016) defines information literacy as “the set of integrated abilities encompassing the reflective discovery of information, the understanding of how information is produced and valued, and the use of information in creating new knowledge and participating ethically in communities of learning” (3). Media literacy, as defined by the National Association for Media Literacy Education (2017), is “the ability to access, analyze, evaluate, create and act using all forms of communication. In its simplest terms, media literacy builds upon the foundation of traditional literacy and offers new forms of reading and writing. Media literacy empowers people to be critical thinkers and makers, effective communicators and active citizens.” We find common ground in these definitions and the values they convey, especially in the degree to which both disciplines prioritize critical thinking about and active engagement with information. In this paper, we invoke a shared definition of digital literacy, referring to the practices, abilities, and identities around the uses and production of information in digital forms.[1]

Our respective understandings of digital literacy have evolved through extensive and ongoing collaboration with each other and with students. Our disciplines both recognize that definitions of literacies are shifting in the digital environment. One premise of our work is that digital technologies afford new possibilities for collaboration across disciplines and fields. We believe that digital teaching and learning benefit from, if not require, connecting diverse ways of knowing. Digital learning emphasizes connectivity and so we have designed our teaching approach to model the same.

What matters most here is how these definitions come to bear on framing student learning outcomes in this course and assignment. There were no digital literacy learning outcomes explicitly embedded within the course syllabus prior to this collaboration. Discussions about how and where to integrate digital literacy goals within existing course assignments gave rise to our collaboration. These discussions revealed that while the course aimed to promote critical thinking and analysis of the so-called information age, it did little to intentionally link theory to critical practice in ways that highlighted development of students’ digital literacy habits and abilities. The library’s statement on information literacy, inspired at the time of its creation by an earlier iteration of the Association of College and Research Libraries information literacy definition, offered a welcome starting point and with very little modification was introduced as a course goal (Trexler Library, Muhlenberg College 2010). Among course objectives, the syllabus newly included this statement: “students in this course will have opportunities to develop capacities as information literate learners who can discover, organize, analyze, create and share information.”

Assignment Design and Instructional Approaches

The Internet Censorship Project required students working in pairs or small groups to investigate the state of internet censorship and surveillance in different countries. The project extended across four weeks in the latter half of the semester. Students shared their research findings in culminating in-class presentations. The entire process was designed to encourage students to link their critical theoretical understanding with digital literacy practices. We purposefully integrated digital tools and pedagogies throughout the assignment to help students move beyond only amassing and describing sources to higher order research activities and more advanced digital literacy behaviors and attitudes.

Our first implementation of this assignment in fall 2013 revealed some of the general challenges of asking students to critically engage with information. Students tended to gather large amounts of information and dump it into their work without clear purpose or analysis. Ultimately, this resulted in lackluster project presentations in which students’ facility with the mode of digital presentation (Prezi) was often more impressive than the story being shared. These issues are not unique to this assignment, course, or campus. Many educators have likely seen evidence of students’ struggles with “information dump.” Information dump demonstrates students have collected relevant data, but they are unable to present it logically or think about it critically and analytically. This challenge relates to larger issues with helping students develop and strengthen their research habits and abilities. There is often a wide gap between where students begin and where we want them to arrive with respect to information gathering, evaluation, analysis, and synthesis. They often do not successfully make the leap from one ledge to the other (Head 2013; Head and Eisenberg 2010). Frequently what seems to be missing is students’ engagement with research as a process and their critical reflection on that process.

Among the many personal benefits students gain from research, they “learn tolerance for obstacles faced in the research process, how knowledge is constructed, independence, increased self-confidence, and a readiness for more demanding research” (Lopatto 2010). Participating in the research process also promotes students’ cognitive development, supporting their transition from novice to expert learners. Undergraduate research encourages students to exercise critical judgment and to make meaning of what they are learning. Such experiences help students construct a sense of themselves as researchers, gaining a sense of agency and ownership of the research process. If today’s students are “at sea in a deluge of data” (Head and Wihbey 2014), carefully crafted research assignments can help them acquire the skills and awareness that serve as life rafts and anchors.

This kind of work presents opportunities to promote students’ metacognition, or awareness of and reflection on their thinking and learning (Livingston 1997). A metacognitive mindset can help students identify their research as a process in which they are located and over which they have agency. “Successfully developing a research plan, following it, and adapting to the challenges research presents require reflection on the part of the student about his or her own learning” (Carleton College 2010, para. 5). By reflecting on their steps and thinking, students can perhaps more easily recognize their choices and beliefs, enhance their ability to plan for and guide their learning, as well as adapt in the face of future challenges or new situations (Lovett 2008). “Seeing oneself as capable of making the crossing to a better understanding can be empowering and even exhilarating….The ability to manage transitional states might be, then, a transferrable learning experience, one that involves increasing self-knowledge and confidence” (Fister 2015, 6).

Close review of Internet Censorship Project student learning outcomes in 2013 informed our revisions to the assignment in fall 2014. (See Appendix A for the assignment.) We strengthened the assignment by gearing it more toward process and reflection. Our goal was to better support students as they worked to bridge the gap, from start to finish, in their research knowledge and abilities. This time around, we emphasized steps within the research process and prioritized the development of critical and reflective thinking about information. We did this by redesigning the project phases and intentionally using carefully selected digital tools.

In the first phase, student partners collaborated to select and organize research sources about internet censorship and surveillance in their selected countries. They used a collaborative, cloud-based word processing application (Google Docs) to gather and share information with each other as they discovered it, working both synchronously and asynchronously. Documents started as running lists of sources with links to original content, but were to evolve into meaningfully and logically organized and annotated texts that demonstrated critical thinking about sources. In fall 2014, we dedicated more in-class time modeling for students how documents might evolve beyond mere lists into collaborative space for organizing, summarizing, assessing, and interrogating information.

We also integrated a crucial new element, a photo journal created in WordPress, into the assignment as a metacognitive bridge to support students’ development from information gathering to presentation. We selected WordPress for this activity for a number of reasons. On a practical level, we have a campus installation of WordPress and strong technology support for it. WordPress is easily customizable, extendable, and enables students to work with the various media types we sought to promote with the assignment. Just as importantly, using WordPress aligned with one of the underlying goals of the course to deepen students’ critical reflection of their own digital presence. We wanted them to gain experience working in a widely-adopted open source environment—approximately 25% of all websites that use a content management system run on WordPress (Lanaria 2015)—so that they might compare this platform to their experiences within commercial social media platforms. Overall, WordPress enabled us to provide students with hands-on experience as information producers that developed digital literacy practices that could serve them well beyond this assignment and course.

The photo journal transformed the assignment in important ways and is the focus of our case study. We described its purpose to students in the following way:

The journal is your individual representation of the process as you experience and construct it. The Photo Journal is created in WordPress and includes photos, images, drawings, screenshots, and narrative text and captions that take the viewer behind the scenes of your research process. Think of this as “the making of” your project, uncovering the questions and thinking behind your project, and documents the “what, why, where, and how” of the research you are producing.

Students were required to create a minimum of 10 posts, the first of which asked students to reflect on their ideal research environment. The final post invited students to contemplate their presentation and completion of the project. In between, the remaining eight journal entries were designed to document and reflect on students’ research experiences. We provided optional prompts to kickstart their posts, including the following:

  • What do you know about the topic? What do you want to know?
  • Why does this source matter?
  • How did you get started?
  • What led you to this source?
  • What questions does the source raise for you?
  • How does the source contribute to other knowledge?
  • What do you know now? What have you learned?

We constructed the photo journal element to activate for students an attitude of critical engagement and a more reflective, metacognitive mindset (Fluk 2015). In documenting their research processes, the photo journal was intended to surface students’ thinking for both themselves and us as instructors. We wanted to promote their reflection on steps in the research process and, therefore, change and deepen that process. By modeling and scaffolding these behaviors and attitudes through the phases of the assignment, we hoped to move students progressively toward stronger engagement and understanding. Rather than drowning in information overload, we hoped to develop students’ sense of agency to be able to comprehend, communicate about, make meaning of, and reflect on their information consumption and production. By asking students to include images as representations of their research, we further hoped to make the research more visible as a process.

Through our qualitative analysis of students’ photo journals in this case study, we attempt to better understand both the connections students make, as well as where they need help to bridge the gaps in their learning. Our case study explores how we can use digital technologies and digital pedagogy to better foster students’ development as digitally literate researchers.

Methodology

In this research, we look closely at student learning outcomes aligned with the digital literacy goals of the Internet Censorship Project. Collectively, the 17 students in fall 2014 generated 170 photo journal entries. Our data collection, coding, and analysis were conducted using Dedoose, a cloud-based platform for qualitative and mixed methods research with text, photos, and multimedia. The program enabled us to organize and code a large set of records.

Each journal entry included a narrative update or reflection on students’ research and a related image. While designated a “photo journal,” students’ posts included a considerable amount of text that is central to this study. Our qualitative content analysis concentrated on students’ description of, and reflection on, their research sources and their research steps and behaviors. We also constructed a series of identity codes to indicate those instances where students self-consciously located themselves within their research and reflected on their research as practice.

Analysis of Students’ Journals

Students’ journals varied in depth, detail, and critical engagement. Two types of journals emerged clearly: robust and limited. In robust journals, students exhibited a general thoughtfulness and demonstrated a more expansive engagement with content of sources and process. Limited journals were generally more superficial and formulaic, focused primarily on content of sources rather than process. We assign these categories to help improve our pedagogy in order to advance student learning.
In the following sections, we discuss three major areas that emerged from our qualitative analysis of student journal data:

  • Students’ engagement as reflected in project pacing
  • Students’ attention to process and content
  • Students’ identity and agency as digital learners

Students’ Engagement as Reflected in Project Pacing

The journal project required that students submit a minimum of ten posts over four weeks at a suggested rate of two to three times per week. Past experience has shown us that students often tend to squeeze their work into a limited time frame. Student Q, for example, described his usual work tendencies in his journal:

“Typically when I study, do research, or write papers, I end up waiting until the last minute. This isn’t really a voluntary practice, I just can’t find the motivation to prioritize long term assignments until the deadline begins closing in.”

By requiring students to post consistently, we aimed to push them beyond their typical practices. We structured the experience so that students could aggregate and analyze information incrementally over time in order to develop more effective research habits—both attitudes and practices—and to avert information overload. We anticipated that students who worked steadily would have more opportunities for progressive development and reflection and therefore would engage more deeply and critically with the sources and the issues addressed in the assignment. We anticipated that students who worked inconsistently, by comparison, would be more likely to engage superficially and minimally achieve project learning goals. Our interest in “students’ engagement as reflected in project pacing,” then, refers both to the timing of students’ journal posts and the pace of students’ work on the project overall.

We characterized students’ journal pacing quality as excellent, good, fair, or poor. Excellent pacing described journals with posts spread evenly throughout the project. Good pacing described journals with posts occurring every week of the project, but with some posts closely grouped on consecutive days or even on the same day. Fair pacing denoted journals with some posts closely grouped on consecutive days or the same days and some multi-day or week-long stretches with no posts. Poor pacing referred to journals with posts primarily grouped on just a few consecutive days or the same days and no posts for long stretches of time.

Robust journals were distributed evenly across all four pacing quality categories: two each in poor, fair, good, and excellent. Limited journals, though, were predominantly in the poor pacing category: seven poor, zero fair, one good, and one excellent.

Calendar marked with four students’ journal posting dates, with each student color-coded to represent one of the four pacing quality categories: Excellent, Good, Fair, Poor

Figure 1. Calendar marked with four students’ journal posting dates, with each student color-coded to represent one of the four pacing quality categories: Excellent, Good, Fair, Poor

Overall, the pattern we saw in the pacing of students’ journals in part supports our intuition. Students who demonstrated lower engagement with content and less reflection on process—that is, students’ whose journals we categorized as limited—appeared to work inconsistently on the project or in a compressed manner. Yet pacing alone is not enough to ensure students’ success, as we saw in the case of robust journals. Their strength was less tied with pacing quality. Perhaps these journals were robust for other reasons such as the students’ developmental levels, their effective integration of our writing prompts, or intrinsic motivation and interest in the assignment. Many factors, then, surely contribute to students’ learning and success, yet students’ reflections suggest that adequate time and project management are among them. Student B, for example, described the positive impact of the assignment’s structure on the pacing of her work:

“The components of the project, the Google Doc, photo journal, and presentation, seemed to work well together to organize our thoughts and pace the research so we did not save it until the last minute. Even though it was a busy week for me, the way the project was set up was very helpful in facilitating the assignment.
This overall experience has taught me a lot about research and organization. It has also given me valuable experience preparing and speaking in front of a class. This project was due during a particularly busy week for me. I had three large assignments due that week, this included, but I learned to cope with that, take things one step at a time, and I am proud of what we were able to accomplish.”

Student C’s comments illustrate how the expectations of a measured pace in the assignments were a challenge for him, but that they contributed to his effectiveness in research and in preparing for his final presentation:

“By the time I finished the research for my journal entries, I had all the information I needed to prepare for my presentation. It was nice to be able to share some of the interesting things I learned about. Meeting with [name redacted] a few times before we had to present was helpful, and gave us a chance to organize and practice. . . . The biggest challenge of this project was staying on top of all my journal entries. Trying to organize how to space them out in a way that made sense, while trying to balance all my other work, was difficult. I had to be extra careful not to forget about them and leave them all to the last minute.”

Articulating and modeling for students effective strategies for doing research over time can contribute to their success with organizing and processing large amounts of information, and help students to develop and sustain deeper engagement in their learning.

Students’ Attention to Process and Content

Our assignment aimed to foster students’ metacognitive awareness of their research process which contributes to students’ learning and is essential to digital literacy. Unprompted, however, students often struggle to engage at this level of critical self-reflection. In our first attempt with this assignment, they tended to focus only on amassing and describing their sources, essentially information dump. We hoped that students’ journals, then, would provide visible evidence of their research processes in order to better understand and reflect on their steps and their thinking. By bringing the process to the surface, we hoped students’ attention would shift beyond just the what of the sources and toward the why and the how of their sources, choices, and processes for richer critical thinking. Therefore, our analysis of student journals naturally aligned into two major categories: content and process. Content codes were used to identify journal excerpts in which students commented on sources in the following ways: summary, assessment, interpretation, connection with other information or personal experience, judgment, and reinforcement/challenge of preconceived notions.

In their journals, all students summarized sources with some frequency. For some, it was the focus of an entire post. For others, an initial summary was a foundation from which they built more diversified or reflective posts. In limited journals, we saw that students often paired the description or summary with their opinions or judgments. The following excerpt from Student I’s journal illustrates this common combination. He began with a summary of a source and then segued to his beliefs on the matter:

“After The London Riots, Prime Minister David Cameron wanted to censor social media, and ban rioters from communicating on these platforms. However, this did not pan out as well as he thought. So, it was back to the drawing board. In another one of Cameron’s plans, he wanted to censor emails, texts, and phone calls. According to the article, internet service providers would have to install hardware that would give law official real-time access to users emails, text messages, and phone calls. . . .

This also relates to the fact that Cameron still wants social media sites to censor their users. I think that this really impedes on a persons’ freedom of speech. If people are posting things on social media, they are public, therefore, they can be seen by whomever. So for instance, if people were planning violent rallies on Facebook, authority members could see this, and stop it before it happened by sending troops to the spot of the rally. Still, this is a major shot at peoples’ freedom of speech, therefore, I do not think it is necessary to take away a persons’ right to post on social media.”

In robust journals, by contrast, students more often paired summary with meaning making—that is, they interpreted the sources and attempted to make connections between different sources or with personal experience, as in this excerpt from Student H’s journal:

“This article focuses on the government trying to control what is posted on social media sites like Twitter, Facebook and YouTube. November of the last year, the Russian government created a law that would allow them to blog any internet consent they deemed illegal or harmful to minors. The only website to resist was YouTube which is owned by Google. They removed one video that promoted suicide, but wouldn’t remove a video that showed how to make a fake wound, because YouTube declared it was for entertainment purposes.

However, when the Federal service for supervision in telecommunications, information technologies and mass communications in Russia went to Facebook and Twitter, they complied with the bans the government gave them. If they didn’t comply the whole site would have been banned from Russia. This source makes me ask was this law only created to protect minors on the internet? Are there other motives with this new law? Will they ban other content that may be appropriate but not agreeable with the Russian’s views? I want to look into what other sites or content this law has been used to ban. This source definitely gave me insight into more issues of censorship occurring in Russia.”

While judgment and meaning making both require students to interact with sources and insert themselves into the conversation, they require rather different levels of critical thinking and self-awareness. With judgment, as illustrated by Student I above, students took a stand or made a claim, often in ways that promoted or reinforced rather than challenged their assumptions. With meaning making, on the other hand, as illustrated by Student H above, students attempted to interpret, clarify, and probe sources. These are different ways of interacting with information. The latter requires a greater degree of critical awareness and self-reflection on the part of the researcher and, therefore, denotes higher order digital literacy.

Process codes were used to identify journal excerpts in which students described their steps, as well as their metacognitive reflection on those steps. They included searching strategies and behaviors, organization, source selection, information availability, use of assigned digital tools (i.e., Google Docs, WordPress, and Prezi), information needs, next steps, and collaboration with their peers.

In limited journals, students frequently described their research steps. In this excerpt, for example, Student O described transitioning from using Google to library databases in order to locate academic sources:

“After finding several newspaper articles on Google, I started to finally look at the academic journals using the library databases. I was shocked to find that there was not that much information about the internet censorship in Iraq considering it is a big controversy. The few articles that I did find did have a lot of useful information to begin sifting through. Looking at the articles from the database is much different from Google because you can read the abstract to find the significance of the article and if it is worth taking a closer look at. I read through some of the abstracts and found some great information from background to actual laws and regulation. Now that I found out so much more information, I need to read through all of the articles diligently and take notes.”

In robust journals, students described their steps, but many also elaborated on why they took those steps and the questions they raised. In the following example, Student F described her use of library databases to locate scholarly sources, but also reflected on her motivation for doing so, her strategy, and the connections between her past experience and her current research:

“For awhile, the only type of research [name redacted] and I had done was through Google. While this was extremely helpful in gathering information and background facts about the censorship in Russia, we thought it was important to ensure we got some information scholarly sources. Using the Trexler Library website, we searched multiple databases searching for information on cyber censorship in Russia. We used information we found in the articles on Google to get more information into our search.

While I know finding scholarly sources is important, I have not always been the biggest fan of database searches. I always get frustrated when I can’t find sources that match what I am looking for. However, after some research, I found some sources with great information. Although the sources we found on Google were from reputable news sources, sometimes using Internet searches does not always produce the most reliable information. We thought it would be a good idea to get started and use scholarly sources to not only gather new information, but to verify the previous information found.”

The student provided insight not only to her awareness of her information needs, but also how her past research experiences were shaping her current work. She also recognized her ability to overcome obstacles and the intellectual rewards of doing so.

Many students described their steps to organize their sources and their work. In robust journals, some also reflected on the ways their organizational practices helped or hindered their effectiveness in managing information and their project. The examples below illustrate this important contrast.

Excerpt of Student O’s journal illustrating organization:

“I printed out most of the article that [name redacted] and I shared in our google doc of research. I have spent the past few hours reading through all of the articles highlighting key points and writing notes for myself in the margins. The notes have different categories to help me organize the research that I have found such as laws, what’s banned, background, etc. I have found this organization to be very useful so far.”

Excerpt of Student M’s journal illustrating organization plus reflection:

“The most difficult part of this project was definitely the research process—I had trouble with the organization of information. I often go overboard in my research process, gathering more information than I need. Sometimes I go so far in depth that I have trouble keeping things straight in my head (even if these things are written down, it’s hard for me to retrieve the information in my brain because I get jumbled and confused due to the abundance of information). So, although organization was the most difficult, this process helped me find ways to organize information in an efficient and helpful manner.

Keeping things in a Google doc. was a great source for me. By compiling all of my research in one place (the Google doc.) I was inspired to work on the research process every day. I’m not sure why the Google doc. provoked me to work on the research process each day, but color coding my sources and breaking things down into categorizes inspired me to do my work (as corny as that sounds). I think part of the reason for this was because the research process felt less daunting when I worked on it a little bit at a time. By creating categories for myself, and working from the question posed in our rubric for the project, I was more able to deconstruct the process. Rather than spending 4 hours research in the library every week, I spent 30-40 minutes researching every day. This was a much better process for me than what I am usually used to doing. Also, I think there may be a chance that since the Google doc. was online, over time I logged onto my e-mail or Facebook I thought of the Google doc. (and it was in my bookmarks bar) which reminded me to work on it.”

Students in robust journals demonstrated more awareness and understanding of their processes. We also saw more evidence of students’ description of and reflection on more inherently metacognitive themes such as identification of their information needs, charting of their next steps, and rationales for the selection of information sources. The excerpts below show the reflection intrinsic in these areas.

Excerpt of Student B’s journal illustrating rationale for selection of information sources:

“I have learned a lot from the research we have done, not only about censorship in Egypt, but also about research in general. It is important to gather information from a variety of sources, and types of sources, to get a full perspective on the issue. We used some informational sources and some current event/popular sources. This allowed us to find out what was happening at the time of the protest and censorship in Egypt as well as the political aspect and how people felt about it.”

Excerpt of Student H’s journal illustrating description of rationale for selection of information sources:

“I’m at the point in my research where I have enough information to satisfy the requirements for this project. I now have to figure out which information is relevant and which is not, what information should go into the presentation? Do we pick information that just covers the surface of all of our research or do we choose to be more specific and go into depth on one topic? I find all the information important and interesting, so how do I pick? I’m going to look at the most reoccurring themes and terms. Organize the content by those subjects and use that in the presentation. My reasoning behind this, is if this the more popular content among different sources than this must be what is more important.”

In limited journals, then, we saw students engaged primarily with specific tools and practices. In robust journals, by contrast, we saw students negotiating the bigger picture of their project. These students reflected on their choices, discussed their place in the project and in the larger information ecosystem, and generally moved toward more analytic thinking. Such awareness and reflection are crucial to digital literacy development.

Students’ Identity and Agency as Digital Learners

When we first implemented this assignment, we noted that students lingered most comfortably in information-seeking mode and struggled with critical analysis and comprehension of the information they were gathering. Recall that our purpose was to integrate and implement digital tools in ways to help students move beyond information-seeking mode to adopt more critical analytic habits and more advanced digital literacy practices. We were especially interested in the possible uses of digital technologies and pedagogies to help demystify research practices for students so that they might identify as researchers. Our goal was to leverage the collaborative, social, and public affordances of digital tools to make research practices more visible. In this iteration, then, we examined journals for instances where students explicitly located themselves within their research and identified themselves as engaged in and driving their research processes. We also included moments where students conveyed their feelings about their research processes—in short, their affective response.

Because we emphasized both the process and product of student research, it was important to pay attention to students’ subjective experiences along the way. We structured the assignment to empower students’ digital literacy practices. As discussed above, students did describe feeling more organized and less overwhelmed with this research project compared to prior experiences. However, we found very little evidence of students overall using their journals to reflect on their identities as researchers. There were little or no differences between robust and limited journals in this category. We did see a difference in students’ remarks concerning their research paths and next steps, though. Students who produced robust journals more often voiced where they were in their research and where they were headed. In this way, they conveyed a sense of self-direction and control over their work.

Students occasionally reflected in their journals about how they were feeling about the research project. This was true in both robust and limited journals. The following excerpts illustrate such instances of affect.

Excerpt of Student M’s journal illustrating description of anxiety:

“I have also included a screenshot of all the tabs I have open on my computer. This is somewhat out of character for me, which is why I thought it would be important to document. Usually, I can’t have more than 4 tabs open at a time or I start to feel disorganized which sometimes makes me anxious. On this particular evening I have so many tabs open they don’t even all show up on the bar itself. These tabs picture the sources I am pulling from while creating my Google doc. The Google doc. is seriously helping me so much—it’s a great organization tool and it’s helping me understand my information in a really efficient way.”

Excerpt of Student A’s journal illustrating description of confidence:

“We were extremely confident and knew that we were talking about.”

Excerpt of Student B’s journal illustrating description of feeling overwhelmed:

“So far, it has been a bit daunting to start finding articles that have good information to use for the project.”

We are wary of conflating students’ affective statements about their research with self-conscious identification as researchers. We do think it is important, though, to note these instances as part of the meaning-making process. The journal provided space for students to give voice to what it feels like to practice research, thereby making public what often remains hidden in undergraduate research.

Research practices are situated in environments, both online and offline. One of the most important choices students make about their research is where it takes place. Our assignment asked students to be attentive to the “spaces” of their research. We asked students to focus on space in the first journal post by reflecting on, describing, and providing photos of their ideal research environments. Our aim was to encourage students to develop awareness that research is situated in contexts and that, to certain degrees, students can make choices that shape where research happens. When students reflect on the place of their research, they locate themselves in place as researchers. There was no difference between robust and limited journals in this category of reflection.

In this excerpt, Student A responds to that initial prompt:

“My ideal place to do research is in my room. It is the only place where I get all of my work done and efficiently at that. I’ll usually play soft music in the background for me to listen to so I don’t get bored while I’m doing my research. I get my work done best when I’m doing it on my own, in my own space, and on my own time. I like to be in control of my environment and if I’m not, I’ll struggle to get my work done. I also like to have a coffee and a water nearby in case I need a drink. When I start my work, I usually have 1 bag of pirates booty or smartpuffs to kickstart my brain and my work. Below is a picture of my desk. Unfortunately, my desk is smaller than it’s been in the past, but it still gets the job done. I’m able to spread out my work as much as I want.”

Beyond the first required prompt about the places where student research happens, we found additional instances where students reflected on the environments of their research. The first post calling students’ attention to place likely helped to train their awareness on this theme later in the project. The following excerpt is from Student M, who paid continuous attention to the contexts of her research throughout the project:

“This has more to do with my working environment right now than my research, but right now as I am doing work my three roommates are in the midst of watching Gilmore Girls (I got their consent to post this picture). I am surprised that I am able to work in this environment, and to be totally honest, I think a lot of the reason is because I do not feel anxious about this information. I know that I still have a lot more research to do and a lot more work on my plate, but rather than finding this overwhelming I am genuinely excited to find a way to put together my information about North Korea so that it makes more sense to me and makes sense to other people.”

Student M’s lack of anxiety stemmed from her ability to control the place and pacing of her research. The excerpt conveys her thoughtfulness about where and when she was doing research. Moreover, it shows her enthusiasm and intention to meaningfully develop her research to benefit her own learning as well as her peers’ learning. Rather than being adrift in a vast sea of information, wading through sources, an awareness of research as situated helps anchor digital literacy practices.

While we understand affect and place as indicators of students’ awareness of themselves as agents within a research activity, there are notably few instances in students’ journals where they explicitly identify themselves as researchers. The following remarks illustrate this infrequent theme.

Excerpt of Student K’s journal illustrating description of feeling like an expert:

“It was also an interesting experience presenting on a topic that no one else in the class had knowledge on besides us, so it made us seem like the experts of subject matter.”

Excerpt of Student P’s journal illustrating description of researcher identity:

“Personally, I try to eliminate all distractions while I’m doing research. Depending upon how pressing the assignment is, I sometimes disable texting and prevent my computer from allowing me to go on Facebook. Ideally, it would be nice to have a private office with a door, but at college, that isn’t really realistic.”

Excerpt of Student Q’s journal illustrating description of connection of research to becoming an informed citizen:

“Researching North Korea’s internet connectivity policies was especially helpful to me in analyzing how our own policies in the USA might parallel. This may help me recognize the consequences of certain laws passed, and ultimately will make me a more informed citizen and voter.”

Beyond research “skills,” our assignment hoped to promote the development of students’ metacognitive awareness of their abilities to effectively engage in research activities using various digital technologies. This includes identifying paths and next steps. When students described their current and future research paths they were locating themselves in the research. Students did not use their journals to explicitly reflect on their development as researchers, but they did frequently identify in detail plans to advance their research. This occurred more frequently in robust than limited journals.

Excerpt of Student H’s journal illustrating description of next steps:

“This time difference has me questioning the relevance of this source and how to related it to my more current sources. Although it is helpful to understanding the background of Russian Internet, I find some of the information contradicting to the current information I have found. From here I think I need to look into more sources about classifications and see if there are more recent publications on this subject.”

Excerpt of Student Q’s journal illustrating description of next steps:

“From here, I think I would like to find out the exact specifics on the restriction imparted on North Koreans in regards to the internet, and look into exactly what the distinctions are between internet users and non-internet users in North Korea (whether it is determined by class, political position, or both). Furthermore, I want to investigate how these restrictions might impact foreigners visiting the country, and how the internet restrictions may also be stemming any information leaks coming from North Korea.”

In these posts, and others like them, students conveyed awareness of where they were in their research processes. They commented on the value and limits of their current searches and sources. They suggested what they needed to do or find next to advance their projects. Often in these posts, they articulated next steps in response to a particular limit or gap in knowledge that they had identified. Such reflection indicates to us an awareness of research as an iterative process, where a student can connect their current information seeking and analysis to their future activities.

Application to Practice

Our analysis guided us to make further assignment revisions for fall 2015. (See Appendix B for the revised assignment.) First, it was clear from our analysis that there was opportunity for us to increase the transparency of the project goals and purposes. We were more intentional in articulating these goals both in the written instructions and in our class discussion of the assignment and its elements. We spoke with students about the value of metacognition and our attempt to direct and focus their awareness in the research process. Second, we recognized that students who used the guiding questions were able to dig deeper and demonstrated stronger learning outcomes. Therefore, not only did we more emphatically urge students to employ the prompts in their journals in fall 2015, we also added new prompts and organized them in two categories (content and process) to better motivate their metacognitive awareness. The table below shows the revised prompts.

Content (commenting directly on sources) Process (commenting on your research steps, struggles, goals)
Describe the source. What led you to this source(s)?
How did you get started?
Why does this source matter? What questions does the source raise for you about your research process?
What questions does the source raise for you about the subject matter? Where does this source lead you next?
How does the source contribute to other knowledge or connect to other information? How is the environment of your research impacting your work? How are you using digital tools to promote your development as a researcher?
What voices or perspectives does the source include? exclude? Take stock of your progress to date. How does it look to you, from a bird’s eye view?

Finally, we saw that students who published to their journals inconsistently also demonstrated a lack of engagement with sources and reflection on process. We therefore modified the assignment to make consistent pacing a formal expectation for the project and included it in the evaluation rubric. (See Appendix C for rubrics.) By making this change, we made the benefit of pacing extended research projects more transparent to students. Our future analysis will consider the impact of these changes on student learning outcomes.

Conclusion

The rapid growth of digital technologies and their integration in higher education is spurring conversation about what it means to be literate in the digital age. On a number of liberal arts campuses across the US, educators are asking, what does “the digital” mean for liberal arts education (Thomas 2014)? Some are now speaking of the Digital Liberal Arts (Heil 2014). Our case study contributes to a growing interest in understanding what digital literacies look like and how these abilities and practices can be developed to enhance learning in the liberal arts.

In our work, we saw students grappling with and frustrated by the challenges of information overload online and offline. While information overload may be an issue, it is a well-worn tendency to blame technology for young people’s deficiencies as learners and citizens. As educators, we must design digital pedagogies that create opportunities for students to navigate this complex environment. The digital pedagogies we are developing begin by shifting the locus of agency from technology back to our students, empowering them to manage the multiple contexts of information they traverse in their learning. By integrating digital tools in research projects that foreground pacing, metacognition, and process, we can help students develop their agency and identities as researchers. This agency is central to what it means to practice digital literacy.

Notes

[1] For additional discussion of digital literacy, information literacy, and media literacy conceptualizations, see Jarson (2015).

Bibliography

Association of College and Research Libraries. 2016. “Framework for Information Literacy for Higher Education.” Last modified January 11. http://www.ala.org/acrl/sites/ala.org.acrl/files/content/issues/infolit/Framework_ILHE.pdf.

Carleton College. 2016. “Why Use Undergraduate Research?” Pedagogy in Action: Connecting Theory to Classroom Practice. Last modified November 14. http://serc.carleton.edu/sp/library/studentresearch/Why.html.

Fister, Barbara. 2015. “The Liminal Library: Making Our Libraries Sites of Transformative Learning.” Keynote address at the Librarians’ Information Literacy Annual Conference, Newcastle upon Tyne, United Kingdom. http://barbarafister.com/LiminalLibrary.pdf.

Fluk, Louise R. 2015. “Foregrounding the Research Log in Information Literacy Instruction.” The Journal of Academic Librarianship 41 (4): 488-498. doi:10.1016/j.acalib.2015.06.010.

Harness, Jill. 2015. “How to Deal with Information Overload.” Lifehack. Accessed September 24. http://www.lifehack.org/articles/productivity/how-deal-with-information-overload.html.

Head, Alison J. 2013. “Learning the Ropes: How Freshmen Conduct Course Research Once They Enter College.” Project Information Literacy, December 5, 2013. http://www.projectinfolit.org/uploads/2/7/5/4/27541717/pil_2013_freshmenstudy_fullreportv2.pdf.

Head, Alison J., and John Wihbey. 2014. “At Sea in a Deluge of Data.” Chronicle of Higher Education. July 7. http://chronicle.com/article/At-Sea-in-a-Deluge-of-Data/147477/.

Head, Alison J., and Michael B. Eisenberg. 2010. “Truth Be Told: How College Students Evaluate and Use Information in the Digital Age.” Project Information Literacy. November 1. http://www.projectinfolit.org/uploads/2/7/5/4/27541717/pil_fall2010_survey_fullreport1.pdf.

Heil, Jacob. 2014. “‘Defining’ Digital Liberal Arts.” Digital Projects and Pedagogy: A Digital Projects Initiative of The Five Colleges of Ohio (blog). March 22. http://digitalscholarship.ohio5.org/2014/03/defining-dla/.

Hemp, Paul. 2009. “Death by Information Overload.” Harvard Business Review 87 (9): 82-89.

Jarson, Jennifer. 2015. “Versus / And / Or: The Relationship Between Information Literacy and Digital Literacy.” ACRLog. October 20. http://acrlog.org/2015/10/20/versus-and-or-the-relationship-between-information-literacy-and-digital-literacy/.

Lanaria, Vincent. 2015. “WordPress Is So Big 25 Percent Of All Websites In The World Run On It.” Tech Times. November 9. http://www.techtimes.com/articles/104519/20151109/wordpress-is-so-big-25-percent-of-all-websites-in-the-world-run-on-it.htm.

Livingston, Jennifer A. 1997. “Metacognition: An Overview.” State University of New York at Buffalo, Graduate School of Education. http://gse.buffalo.edu/fas/shuell/cep564/metacog.htm.

Lopatto, David. 2010. “Undergraduate Research as a High Impact Practice.” Peer Review 12 (2). https://www.aacu.org/publications-research/periodicals/undergraduate-research-high-impact-student-experience.

Lovett, Marsha C. 2008. “Teaching Metacognition.” Paper presented at the Educause Learning Initiative Annual Meeting, San Antonio, Texas, January 29. http://net.educause.edu/upload/presentations/ELI081/FS03/Metacognition-ELI.pdf.

National Association of Media Literacy Education. 2017. “Media Literacy Defined.” National Association of Media Literacy Education. Accessed April 10. http://namle.net/publications/media-literacy-definitions/.

Shenk, David. 1997. Data Smog: Surviving the Information Glut. Rev. ed. New York: HarperCollins.

Shin, Laura. 2014. “10 Steps to Conquering Information Overload.” Forbes. November 14. http://www.forbes.com/sites/laurashin/2014/11/14/10-steps-to-conquering-information-overload/.

Tattersall, Andy. 2015. “How to Cope with Information Overload.” CNN. May 13. http://www.cnn.com/2015/05/13/opinions/surviving-information-overload/.

Thomas, William G., III. 2014. “Why the Digital, Why the Digital Liberal Arts?” Lecture at Digital Liberal Arts Initiative at Middlebury College, Middlebury, Vermont, December 8. http://railroads.unl.edu/blog/?p=1149.

Trexler Library, Muhlenberg College. 2010. “Trexler Library Statement on Information Literacy.” Last modified February. http://trexler.muhlenberg.edu/about/policies/information-literacy.html.

Vulliamy, Ed. 1996. “If You Don’t Have the Time to Take In All the Information in this Report You Could be Suffering from a Bout of Information Fatigue Syndrome.” The Guardian, October 15.

Appendices

Note: Appendix materials appear as the original, unmodified versions submitted to students in 2014 and 2015.

Appendix A: Fall 2014 Assignment

Country Internet Censorship & Surveillance Report

This assignment puts students in the driver’s seat by asking you to collaboratively research the state of internet censorship in a specific country and report out to the larger class on your findings. This assignment moves beyond the borders of our local experiences to situate questions about censorship, surveillance, and privacy in a global context.

Recall that the primary goal of this course is to introduce students to some key conceptual tools for thinking critically about new information technologies in a global, technological society. This project also entails developing students’ capacities as digitally literate learners who can discover, organize, analyze, create, and share information in order to achieve their goals as learners and as citizens. Digitally literate students will thereby develop an intellectual framework for critical analysis and reflection on diverse information resources.*

This project extends beyond the borders of our class and relies on critical partnerships with Jen Jarson, Social Sciences Librarian at Trexler Library, and Tony Dalton, Digital Cultures Media Assistant, who are contributing their respective areas of expertise to enrich the learning activity and experience. This assignment has been collaboratively developed with Jen and aims to integrate deeply the digital literacy practices that are central to our learning goals this semester. Additionally, Tony will be visiting class to make sure you have the support necessary to develop the digital literacy skills necessary to work with WordPress and Prezi platforms.

Project Overview

With a partner, you will select in class on October 21 a country to research in class on October 21. Your research is concerned with the following basic issues related to iInternet censorship:

  • Classifications: Hhow do various reports and organizations rate or rank the country in terms of iInternet freedom? Consult multiple sources for this information, for example: Reporters without Borders’ “Enemies of the Internet” and “Countries Under Surveillance,” Freedom House’s “Freedom on the Net,” OpenNet Initiative, etc.
  • Censorship: What is the nature of iInternet censorship in the country you are researching? Political, social, other? What are the laws pertaining to iInternet censorship? What sanctions are in place to punish citizens who violate country censorship laws?
  • Surveillance: What is known about the state of iInternet surveillance in the country? What particular forms of iInternet based surveillance are employed by the government to monitor online activities of citizens? What online activities are most targeted?
  • Advocacy: What local or international efforts are focused on protecting iInternet freedom in the country? Are there particular examples or cases that have been rallying points for advocacy to protect access to information and the iInternet?

Project Elements

This project is comprised of three elements, each worth 10 points (overall points = 30 points):

1. A shared Google Doc where you will collaborate to select and organize your research sources. Your overall project is only as strong as the research beneath it. An evolving document throughout your research. It may start as a running list of sources, however it should evolve into a document that meaningfully organizes and evaluates your information. We will work with an example in class. (You are creating one document per pair). Include in your doc citations to all sources, and include hyperlinks to original content. More than a compilation of citations, your document should also demonstrate how you are interpreting and evaluating the information included. For example, this might take the form of annotations, asking questions about the source, etc. (Partners receive same points.)

2. An individual Photo Journal where you will document your research process and practices. Although you are researching collaboratively, the journal is your individual representation of the process as you experience and construct it. The Photo Journal is created in WordPress and includes photos, images, drawings, screenshots, and narrative text and captions that take the viewer behind the scenes of your research process. Think of this as “the making of” your project, uncovering the questions and thinking behind your project, and documents the “what, why, where, and how” of the research you are producing. Each student will create their own WordPress blog as the platform for the Photo Journal. During the course of the project, you will document and reflect on your research in a minimum of 10 posts. (Individual points.)

First journal entry prompt (due October 23): What does your ideal research environment look like, what does it include, what does it sound like? And why? Post an image (or images) and your reflection on these first steps.

Eight journal entries are due between October 24 and November 13. Post 2-3 times per week as your research evolves over time. We’re trying to uncover and investigate your research processes and pathways and what you think about them. You may have your own thoughts about how to approach this in your posts, or you may find useful choosing from the following prompts to kickstart your reflections (there is no order to these prompts or limit to how often you can use or adapt them):

  • What do you know about the topic? What do you want to know?
  • Why does this source matter?
  • How did you get started?
  • What led you to this source(s)?
  • What questions does the source raise for you?
  • How does the source contribute to other knowledge?
  • What do you know now? What have you learned?

Last journal entry prompt (due November 20): Post a photo from your class presentation and reflect on your presentation as the culmination of your research project. What do you think was effective and why? Overall, what was the biggest challenge of this project for you?

3. The culminating element is a collaborative presentation, built in Prezi with your partner, sharing your research with your peers. Your 10-12 minute presentation captures your research in text and image and effectively and compellingly shares the story with your peers in class (on either November 11 or November 13). (Partners receive same points)

Tips on Creating a Compelling Presentation

  • More than just a 10 minute delivery of information, your presentation—delivered with Prezi—should demonstrate clear ideas about and a thorough understanding of issues of censorship and surveillance in your specific country. Depth of knowledge, accuracy, and interest of information, are all essential to a compelling presentation.
  • Your presentation should pay close attention to your audience—make eye contact, consider pacing and flow of presentation, use images and multimedia effectively to keep audience engaged.
  • Images, videos, links should be integrated to enhance your presentation but they should not comprise the entire presentation. Videos can add to a presentation, but remember that the presentation is your own original take on the issues at hand: don’t include a 5 minute video of someone else talking on your topic. Rather, use clips selectively and to serve your main points.
  • Proofread carefully to ensure there are no spelling or grammatical mistakes.
  • It’s your choice whether to provide handouts with your presentation. If you do, make sure they are integrated into your presentation and serve a clear purpose, not just information overload.
* adapted from the Trexler Library statement on information literacy with assistance from Jennifer Jarson.

This work is licensed under a Creative Commons Attribution-NonCommercial-ShareAlike 4.0 International License (http://creativecommons.org/licenses/by-nc-sa/4.0/).

Appendix B: Revised (Fall 2015) Assignment

Country Internet Censorship & Surveillance Report

This assignment puts students in the driver’s seat by asking you to collaboratively research the state of internet censorship in a specific country and report out to the larger class on your findings. This assignment moves beyond the borders of our local experiences to situate questions about censorship, surveillance and privacy in a global context.

Recall that the primary goal of this course is to introduce students to some key conceptual tools for thinking critically about new information technologies in a global, technological society. This project also entails developing students’ capacities as digitally literate learners who can discover, organize, analyze, create, and share information in order to achieve their goals as learners and as citizens. This project helps you develop digital literacy through “the reflective discovery of information, the understanding of how information is produced and valued, and the use of information in creating new knowledge and participating ethically in communities of learning.”*

This project extends beyond the borders of our class and relies on critical partnerships with Jen Jarson, Social Sciences Librarian at Trexler Library, and Tony Dalton, Digital Cultures Media Assistant, who are contributing their respective areas of expertise to enrich the learning activity and experience. This assignment has been collaboratively developed with Jen and aims to integrate deeply the digital literacy practices that are central to our learning goals this semester. Additionally, Tony will be visiting class to make sure you have the support necessary to develop the digital literacy skills necessary to work with WordPress and Prezi platforms.

Project Overview

With a partner, you will select in class on November 4 a country to research. Your research is concerned with the following basic issues related to internet censorship:

  • Classifications: how do various reports and organizations rate or rank the country in terms of internet freedom? Consult multiple sources for this information, for example: Reporters without Borders’ “Enemies of the Internet” and “Countries Under Surveillance,” Freedom House’s “Freedom on the Net,” OpenNet Initiative, etc.
  • Censorship: What is the nature of internet censorship in the country you are researching? Political, social, other? What are the laws pertaining to internet censorship? What sanctions are in place to punish citizens who violate country censorship laws?
  • Surveillance: What is known about the state of internet surveillance in the country? What particular forms of internet based surveillance are employed by the government to monitor online activities of citizens? What online activities are most targeted?
  • Advocacy: What local or international efforts are focused on protecting internet freedom in the country? Are there particular examples or cases that have been rallying points for advocacy to protect access to information and the internet?

Project Elements

This project is comprised of three elements, each worth 10 points (overall points = 30 points):

1. A shared Google Doc where you will collaborate to select and organize your research sources. Your overall project is only as strong as the research beneath it. An evolving document throughout your research. It may start as a running list of sources, however it should evolve into a document that meaningfully organizes and evaluates your information. We will work with an example in class. (You are creating one document per pair). Include in your doc citations to all sources, and include hyperlinks to original content. More than a compilation of citations, your document should also demonstrate how you are interpreting and evaluating the information included. For example, this might take the form of annotations, asking questions about the source, etc. (Partners receive same points.)

2. An individual Photo Journal where you will document your research process and practices. Although you are researching collaboratively, the journal is your individual representation of the process as you experience and construct it. The Photo Journal is created in WordPress and includes photos, images, drawings, screen shots, and narrative text and captions that take the viewer behind the scenes of your research process. Think of this as “the making of” your project, uncovering the questions and thinking behind your project, and documents the “what, why, where, and how” of the research you are producing. Each student will create their own WordPress blog as the platform for the Photo Journal. During the course of the project, you will document and reflect on your research in a minimum of 10 posts. (Individual points.) Your photo journal should attempt to creatively represent your research process, in images and text, represent your research process. More than mere illustrations of the content you are working with, the photo journal should document the work itself, what you are doing and thinking to advance your project.

First journal entry prompt (due Monday, November 9):
What does your ideal research environment look like, what does it include, what does it sound like? And why? Post an image (or images) and your reflection on these first steps.

Eight journal entries are due between November 10 and December 7. Post 2-3 times per week, each week, as your research evolves over time. This project cannot be undertaken at the last minute. We’re trying to uncover and support your research processes and pathways and your awareness of those processes. The following prompts will help kickstart your reflections. There is no order to these prompts or limit to how often you can use or adapt them, but your entries should include a balanced mix of “content” and “process” reflections.

Content (commenting directly on sources) Process (commenting on your research steps, struggles, goals)
Describe the source. What led you to this source(s)?
How did you get started?
Why does this source matter? What questions does the source raise for you about your research process?
What questions does the source raise for you about the subject matter? Where does this source lead you next?
How does the source contribute to other knowledge or connect to other information? How is the environment of your research impacting your work? How are you using digital tools to promote your development as a researcher?
What voices or perspectives does the source include? exclude? Take stock of your progress to date. How does it look to you, from a bird’s eye view?

Last journal entry prompt (due December 11): Post a photo from your class presentation and reflect on your presentation as the culmination of your research project. What do you think was effective and why? Overall, what was the biggest challenge of this project for you?

3. The culminating element is a collaborative presentation, built in Prezi with your partner, sharing your research with your peers. Your 10-12 minute presentation captures your research in text and image and effectively and compellingly shares the story with your peers in class (on either December 7 or December 9). (Partners receive same points)

Tips on Creating a Compelling Presentation

  • More than just a 10 minute delivery of information, your presentation—delivered with Prezi—should demonstrate clear ideas about and a thorough understanding of issues of censorship and surveillance in your specific country. Depth of knowledge, accuracy, and interest of information, are all essential to a compelling presentation.
  • Your presentation should pay close attention to your audience—make eye contact, consider pacing and flow of presentation, use images and multimedia effectively to keep audience engaged.
  • Images, videos, links should be integrated to enhance your presentation but they should not comprise the entire presentation. Videos can add to a presentation, but remember that the presentation is your own original take on the issues at hand: don’t include a 5 minute video of someone else talking on your topic. Rather, use clips selectively and to serve your main points.
  • Proofread carefully to ensure there are no spelling or grammatical mistakes.
  • It’s your choice whether to provide handouts with your presentation. If you do, make sure they are integrated into your presentation and serve a clear purpose, not just information overload.

Evaluation Rubrics
See Appendix C for rubrics.

* Association of College and Research Libraries, Framework for Information Literacy for Higher Education, http://www.ala.org/acrl/standards/ilframework.

This work is licensed under a Creative Commons Attribution-NonCommercial-ShareAlike 4.0 International License (http://creativecommons.org/licenses/by-nc-sa/4.0/).

Appendix C: Revised (Fall 2015) Assignment Rubrics

Internet Censorship Project: Google Docs Rubric (Team)

A. Accesses needed information
Accesses a relevant and diverse pool of information sources.

___ Exceeds expectations ___ Meets expectations ___ Does not meet expectations

B. Interprets and evaluates information and its sources critically
Annotations demonstrate interpretation and evaluation of selected sources using multiple criteria (such as relevance to the research question, currency, and authority).

___ Exceeds expectations ___ Meets expectations ___ Does not meet expectations

C. Organizes information effectively to accomplish a specific purpose
Communicates, organizes, and synthesizes information from sources. Intended purpose is achieved.

___ Exceeds expectations ___ Meets expectations ___ Does not meet expectations

D. Cites information appropriately and effectively
As appropriate: uses citations and references; paraphrases, summarizes, and/or quotes information; uses information in ways true to the original context; distinguishes between common knowledge and ideas requiring attribution. Document is fully hyperlinked.

___ Exceeds expectations ___ Meets expectations ___ Does not meet expectations


Internet Censorship Project: Photo Journal Rubric (Individual)

A. Creates/selects representative images
Effectively documents in images research processes and paths.

___ Exceeds expectations ___ Meets expectations ___ Does not meet expectations

B. Uncovers and reflects on research
Provides evidence of thoughtful reflection about research processes and paths.

___ Exceeds expectations ___ Meets expectations ___ Does not meet expectations

C. Posts at regular intervals (2-3 times per week)
Demonstrates sustained engagement in research process throughout project.

___ Exceeds expectations ___ Meets expectations ___ Does not meet expectations


Internet Censorship Project: Presentation and Prezi Rubric (Team)

A. Determines the extent of information need
Defines scope of the research and determines key concepts.

___ Exceeds expectations ___ Meets expectations ___ Does not meet expectations

B. Accesses needed information
Accesses a relevant and diverse pool of information sources.

___ Exceeds expectations ___ Meets expectations ___ Does not meet expectations

C. Evaluates information and its sources critically
Demonstrates critical evaluation of information using multiple criteria (such as relevance to the research, currency, authority, etc.).

___ Exceeds expectations ___ Meets expectations ___ Does not meet expectations

D. Uses information effectively to accomplish a specific purpose
Communicates, organizes, and synthesizes information from text and image sources effectively. Intended purpose is achieved.

___ Exceeds expectations ___ Meets expectations ___ Does not meet expectations

E. Cites information appropriately and effectively
As appropriate: uses citations and references; paraphrases, summarizes, and/or quotes information; uses information in ways true to the original context; distinguishes between common knowledge and ideas requiring attribution.

___ Exceeds expectations ___ Meets expectations ___ Does not meet expectations

F. Effectively delivers presentation
Delivery is paced appropriately for a 10-12 minute presentation and is well-practiced. Speaks clearly. Presenters wWork in complement to each other, such that presentation is delivered collaboratively. Attentive to the audience and uses a purposeful structure to organize presentation. Tells story in a compelling way.

___ Exceeds expectations ___ Meets expectations ___ Does not meet expectations

This work is licensed under a Creative Commons Attribution-NonCommercial-ShareAlike 4.0 International License (http://creativecommons.org/licenses/by-nc-sa/4.0/).

About the Authors

Lora Taub-Pervizpour is Professor of Media and Communication and the Associate Dean for Digital Learning at Muhlenberg College. She teaches courses on documentary research, new media literacies, new information technologies, and youth media. As associate dean, her focus is on developing initiatives in digital learning that value and amplify student voice and empower faculty and students to build a meaningful digital presence.

Jennifer Jarson is the Information Literacy and Assessment Librarian at Muhlenberg College. She is an ardent advocate for the role of libraries and librarians in advancing teaching and learning excellence. Her research interests include information literacy pedagogy and student learning assessment, as well as issues regarding communication, collaboration, and leadership.

1

A Constructivist Approach to Teaching Media Studies Using Google Drive

Abstract

In this paper we consider online teaching and learning from a constructivist pedagogic perspective and illustrate how learning theory connects to teaching practice in online contexts. To do this we employ an Ontario Media Studies grade 11 course unit to explain how Google Drive applications provide the necessary tools to facilitate constructivist online learning. The media studies unit is a culmination of years of iterations and reflection on the delivery and efficacy of media lessons online. First, the Google online learning environment (GOLE) is discussed in relation to constructivist learning theory, and the grade 11 media studies unit objectives and expectations are explained. Second, the applicability of various Google Drive tools for the constructivist teaching and learning activities related to the unit are considered. We then focus on how the media studies unit will be taught using the GOLE. The administration and unit plan are outlined and decisions regarding learning activities and various Google Drive tools are justified. Finally, two lessons are described in detail to illustrate how constructivist learning theory informs the teaching of various unit tasks and activities. It is our hope that in sharing this sample unit and accompanying theory, other educators can learn from, and adapt our work for their own courses.

Introduction

In the past twenty years, a series of profound technological developments has impacted education. Newly emerging technological tools, applications, and online learning environments present opportunities and possibilities for peers to collaborate in new ways, irrespective of location. As seasoned educators, we have experienced the shift towards online learning in the form of blended and flipped classrooms as well as fully online, credited courses. An integral part of this shift is the role online tools play in facilitating learning, and how the implementation and use of these tools impacts instructional design and online pedagogy. As practitioners, we experiment with online tools to establish what does and does not work in a given learning context. This is important work. However, as educators we also have a responsibility to ensure learning theory and research inform our decision making when planning, reflecting on, and evaluating curriculum tasks, activities, and pedagogic practices.

In this paper we examine a sample media studies unit within a constructivist learning theory framework to show how Google Drive tools can be used as an effective online learning environment (OLE). Although Google tools have been discussed here in JITP and in other reputable publications such as Kairos, the aim of this paper is to illustrate how modern online pedagogic practice and tools connect to key founding theories of constructivism and online learning. The sample media studies unit is a culmination of years of iterations and reflection on the delivery and efficacy of media lessons online. The Ontario Media Studies grade 11 course curriculum is used to illustrate how various Google Drive tools provide the appropriate affordances to facilitate constructivist online learning. While this is an elective course for Ontario students, each grade in the secondary school curriculum contains a media studies strand in the mandatory English curriculum, hence the unit can be adapted for Ontario English courses. It is our hope that in sharing this sample unit and accompanying theory, other educators can learn from, adapt, and build on our work for their own use, not only in media-related courses, but in other subject areas as well. Prior to this, an overview of some of the more pertinent constructivist theories and approaches used in the design of the Google online learning environment (GOLE) is provided.

The Theory behind the Practice

Highly influential constructivist education writers and researchers (Dewey 1916; Piaget 1973; Vygotsky 1978; Bruner 1996) all agree that active learning and the construction of new knowledge is based on prior knowledge, and that the role of the instructor is that of facilitator. Moreover, Dewey (1916) argues that the improvement of the reasoning process is a key function of education. Indeed, utilizing problem-solving methods on personally meaningful and real life problems can act as motivation for students, engaging them in process of discovery. With this in mind, the design plan for our GOLE ensures students have every opportunity to utilize their critical thinking skills and prior knowledge, while making personally relevant choices about what topics and themes to investigate in the media studies unit.

Dewey (1938) also argues that interaction is one of the most important elements of a learning experience and that “an experience is always what it is because of a transaction taking place between an individual and what, at the time, constitutes his environment…” (Dewey 1938 cited in Vrasidas 2000, 1). The GOLE design acknowledges the reciprocal nature of learning interaction and the variety of relationships and communicative exchanges required to facilitate meaningful learning (Simpson & Galbo 1986). As the teacher facilitates activities throughout the course, they should consider the nature and types of interaction present in learning environments: learner-learner, learner-teacher, and learner-content (Moore 1989), as well as the ways these interactions translate to an online learning environment. This social constructivist approach stresses the critical importance of interaction with others in cognitive development and emphasizes the role of the social context in learning (Huang 2002).

Vygotsky (1978) details the concept of the Zone of Proximal Development (ZPD) and explains how important social interaction is in the psychological development of the learner. Vrasidas (2000) describes the ZPD as, “the distance between the actual developmental level as determined by independent problem solving and the level of potential development as determined through problem solving under adult guidance or in collaboration with more capable peers” (10). The GOLE features afford students multiple opportunities to learn with others and advance their knowledge through collaboration, working with a variety of learners in different activities using a selection of Google Drive tools.

Class Introduction, Overview of Media Studies Unit, and Expectations

The proposed unit for a media studies course is based on best practices and pedagogy from previous media studies lessons conducted in online learning environments. A Grade 11 English Media Studies course from the Ontario Curriculum is the site of this unit. Figure 1 provides a breakdown of the unit sections and related objectives/expectations.

Unit Sections Unit Objectives
A. Understanding and Interpreting Media Texts 1. Understanding and responding to media texts:

– demonstrate understanding of a variety of media texts;

2. Deconstructing media texts:

– deconstruct a variety of types media texts, identifying the codes, conventions, and techniques used and explaining how they create meaning.

B. Media and Society 1. Understanding media perspectives:

– analyze and critique media representations of people, issues, values, and behaviors;

2. Understanding the impact of media on society:

– analyze and evaluate the impact of media on society.

C. The Media Industry 1. Industry and audience:

– demonstrate an understanding of the ways in which the creators of media texts target and attract audiences;

2. Ownership and control:

– demonstrate an understanding of the impact of regulation, ownership, and control on access, choice and range of expression.

D. Producing and Reflecting on Media Texts 1. Producing media texts:

– create a variety of media texts for different audience;

2. Careers in media production:

– demonstrate an understanding of roles and career options in a variety of media industries;

3. Metacognition:

– demonstrate an understanding of their growth as media consumers, media analysts, and media producers.

Figure 1: Grade 11 English Media Studies from the Ontario Curriculum

Overall expectations addressed in the proposed unit include:

  • Industry and Audience: demonstrate an understanding of the ways in which the creators of media texts target and attract audiences.
  • Producing Media Texts: create a variety of media texts for different audiences and purposes, using effective forms, codes, conventions, and techniques.
  • Metacognition: demonstrate an understanding of their growth as media consumers, media analysts, and media producers.
  • Deconstructing Media Texts: deconstruct a variety of types of media texts, identifying the codes, conventions, and techniques used and explaining how they create meaning.
  • Understanding and Responding to Media Texts: demonstrate understanding of a variety of media texts. (The Ontario Curriculum Grades 11-12: English, 2007)

The Online Learning Environment: Why Google Drive?

When thinking about designing a constructivist OLE it is useful to consider how social constructivist theory can inform which tools to include in it. Vygotsky (1978) argues that people socially construct meaning and cultural norms and that learning is situated. Lave and Wenger (1991) suggest implicit and explicit knowledge is acquired through legitimate participation in situated communities of practice (CoP). Learners participate on the periphery of an activity within a CoP and as they participate and learn they become more knowledgeable. This enables them to move, if they wish, towards the center of the CoP and play a larger role in the communities’ activities. The central idea of situated learning is that learners appropriate an understanding of how to view meanings that are identified with the CoP, and that this process forms a learner’s identity within the learning community. For example, to become a television production assistant a person must appropriate the skills, values, and beliefs required in the practice of working in the television industry.

Hung and Chen (2001) provide a number of design considerations related to situated learning that can help learning designers decide what tools need to be included in an OLE to best support constructivist learning. They argue situatedness can be fostered by contextualized activities that encourage implicit and explicit knowledge acquisition such as projects based on the demands and requirements of the course curriculum. Furthermore, students need to be able to access their OLE in their situated contexts at any time and preferably on portable devices.

Hung and Chen (2001) suggest students also need to learn through reflection and internalize social learning through metacognitive activities such as journaling and asynchronous discussion. Google Drive is available online on portable devices and includes the weblog (blog) software Blogger in its suite of applications. Blogs can be used as interactive online journals, which can be personalized by the learner and used for important metacognitive reflective activities essential for deep learning (Sawyer 2008).

Also as Bereiter (1997) argues, electronic records of learners engaged in discourse on networked computers produce significant knowledge artifacts in and of themselves. These knowledge artifacts are essential for educators because “knowing the state of a learner’s knowledge structure helps to identify a learner’s zone of proximal development” (Boettcher 2007, 4); which in turn allows educators to understand where and when learner scaffolding is required within the OLE.

Hung and Chen (2001) also introduce the concept of commonality, the idea that learning is social and identity is formed through language, signs, and tools in CoPs. They explain that commonality can be fostered through learners having shared interests in books, for example, or having shared assignment problems. Learning designers can leverage commonality and embed tools in their OLEs that enable students to communicate and collaborate on their common interests.

Google Drive has several tools that enable collaboration through computer mediated discourse. These tools include Google Messenger (synchronous and asynchronous text and video messaging), Google Circles (synchronous and asynchronous text messaging and multimedia sharing), and Google Hangouts (synchronous video chat with up to nine people at once, face-to-face-to-face). The interactive nature of blogs also allows them to be used for communicating and sharing ideas within online CoPs. In terms of assessing student engagement and interaction, the revision history tool in Google Docs allows teachers to follow the contributions of each student by observing their writing and editing process, as well as the comments they post to their peers.

Google Drive has several other tools suitable for the online administration of courses. Gmail, the email application, can be used for formal teacher-student correspondence and the distribution of grades and other important announcements. Google Calendar is suitable for updates about the syllabus and deadlines and alerts regarding the course. Google Docs can be used to construct online surveys and polls, often used by constructivist educators to allow learners to vote on aspects of the course they would like to change in some way or for students conducting research of their own. In addition, Google Drive folders can house the course documents; the syllabus, readings, FAQs, and sign up forms can be accessed and updated from anywhere at any time. Student folders can be created on Google Drive for students to upload their work. Educators can use Google Hangouts to discuss group work in online video conferences. Furthermore, YouTube (part of Google) is an ideal platform to present digital artifacts that illustrate project based learning. The affordances Google Drive technology provides learners are numerous (see figure 2).

Quinton (2010) notes that it is essential for student learning that dynamically constructed learning environments be customized to meet the preferences and needs of individual learners in OLEs. The integrated nature of Google Drive enables all course communication, discussion, administration, and student work presentation to be fully integrated and customized to the learners’ needs. Users can personalize their settings and receive updates and notifications about all activity on the course. The GOLE enables students to communicate informally, fostering social presence, either by using one-to-one synchronous messages on Google Messenger, or by setting up their own Google Circle for group chat.

Formal discussions and reflection are afforded by Google Circles, Google Hangouts, and Blogger. Note, Google Hangouts enables synchronous video conferencing. This affordance is particularly useful for teaching and learning because OLEs often do not enable the interactants to see one another’s paralanguage, making the possibility of misunderstanding common, particularly for people from different cultural backgrounds (Dillon, Wang, & Tearle 2007).

An Illustration of the Google Online Learning Environment (GOLE).

Figure 2. An Illustration of the Google Online Learning Environment (GOLE).

Educators and groups of students can see, hear, and talk to each other at scheduled times using Google Hangouts, which has the potential to really boost the social, teaching, and, subsequently, the cognitive presence on GOLE courses. Students have numerous customizable applications to compose and display their learning, such as the Blogger, YouTube, and Google Presentation applications as well as word processing, drawing, and spreadsheet software. All these applications empower users to share and collaborate with each other and determine who can see and contribute to whatever they are working on prior to when it is presented for feedback. Used appropriately, the tools in Google Drive facilitate distributed constructionism, whereby learner knowledge emerges from the distributed discourses and knowledge artifacts they have access to in their OLE (Salomon 1994).

Administration and Unit Plan

From our experience teaching in OLEs, we conceive three key objectives at the course start: acclimatizing students to the online environment, establishing a community of learners, and making explicit the goals and objectives of the course. Early peer to peer and peer to instructor interaction is essential because, as Garrison & Arbaugh (2007, 60) point out, “it takes time find a level of comfort and trust, develop personal relationships, and evolve into a state of camaraderie.” Furthermore, positive social climates promote the rapid mastery of the hidden curriculum and enhances group tasks, self-disclosure, and socio-emotional sharing (Michinov, Michinov, & Toczek-Capelle 2004).

Therefore, one of the first activities in our unit plan requires students to create a biography using general questions and prompts from the teacher, and to share it using Google Docs. For example, we incorporate a simple media studies-related icebreaker using threaded discussions. Students post to the discussion board three personality traits, three favorite television shows, three favorite musicians, and three most used websites. Students are then asked to find at least three other students they have something in common with and write a response. In our experience, sharing commonalities and interests builds rapport and community in peer groups, particularly if this is done at the start of the course.

At the same time, educators must be mindful of critical pedagogy and how identity can play out in online environments. While the opportunity for disembodiment and the de-emphasis on race, class, and gender in virtual environments can lead to many positive possibilities, caution is warranted. As Dare (2011, 3) argues “the constitution of the online classroom as a color-blind space free of raced and sexed bodies is one which deserves greater reflection by examining the implications of ‘disembodying’ students and instructors in the virtual classroom, within the context of classes about race, gender, and globalization.” Such awareness is a necessity and instructors should work to create an inclusive, supportive, and non-threatening community. We have found the best practice is to allow each student to regulate how and what they choose to share about their identity with their peers over time.

During the first week, students are asked to watch an introductory YouTube video created by the instructor using screen capture software such as Jing. The video serves to welcome students and provide a virtual tour of the Google Drive platform, which assists students in locating administrative information to begin the course. All Administrative documents (course outline, assessment and evaluation information, online etiquette, and so on) need to be detailed and explicit to reduce uncertainty, and they should remain in one Google Doc folder for easy reference.

In the administrative section, students should also have access to their grades and feedback through the Google Spreadsheets feature. Students require opportunities to play an active role in their learning process and self-evaluation, through the negotiation of course objectives, content, and evaluation. In previously taught courses, our students have written reflections alongside the teacher-produced grade reports, putting the onus on students to take responsibility for their progress and next steps. Active participation, a central tenet of constructivism, increases the likelihood of embracing and accomplishing tasks used to facilitate learning (Vrasidas 2000).

Finally, a section for technical help should be made available to students using the Google Communities feature. Here, students can post questions and discuss technical issues they may be facing with Google Drive tools, allowing them to collaboratively diagnose problems and find solutions. In our courses, we encourage students to ask course and technical questions in the group forums rather than emailing the instructor. Doing so allows an opportunity for other students to come forward and support others with their knowledge, while also reducing repetitive emails to the instructor with the same questions. This feature “connect[s] people to people and information, not people to machines[,]” and enables students to “engage in collaborative knowledge production and facilitation of understanding—in effect, a connected network of mentors/ interest /practice” (Quinton 2010, 346-47). A high level of teacher presence is required at this stage to monitor the OLE and ensure that any outstanding issues are fully resolved in a timely manner.

Sample Unit Plan: Our Mediated Environment

The sample unit provided below highlights the type of lessons, activities, exercises, and assignments students engage in throughout the course. (Some lesson plans have been adapted from curriculum materials freely available at Mediasmarts.ca and the Association for Media Literacy).

Part One: Marketing to Teens

Throughout the first unit (3-4 weeks), the teacher should moderate class discussions, and explicitly model some of the skills, strategies, and critical thinking techniques that students will need to acquire for moderating future class discussions. As Vrasidas (2000) points out, “having students work in groups to moderate discussions, organize debates, summarize points, and share results will help them achieve their full potential” (10). Following the first unit, pairs of students should select a week to moderate the discussions (based on a topic/ theme of interest) in partnership with the teacher.

In addition to modeling discussion-moderation techniques, the teacher can provide a tip sheet of strategies and offer constructive feedback during their moderation period. As Brown, Collins, and Duguid (1989) conclude, “to learn [how] to use tools as practitioners use them, a student, like an apprentice, must enter that community and its culture. Thus, in a significant way, learning is […] a process of enculturation” (33). Furthermore, research demonstrates that teacher presence plays an important role in enabling students to reach the highest levels of inquiry (Garrison et al. 2001; Luebeck & Bice 2005).

Lesson 1

Students are assigned two readings online: How Marketers Target Teens and Advertising: It’s Everywhere (Media Smarts n.d.) to introduce concepts such as psychology and advertising, targeted advertising, building brand loyalty, ambient and stealth advertising, commercialization in education, and product placement. Students begin the first threaded discussion using Google Circles with a series of questions and prompts regarding the ubiquitous nature of advertisements targeted at youth. For example, guided prompts might ask questions such as “why are youth important targets for marketers?” “how do marketers reach teens?” or “which media advertisements do students feel have the greatest appeal and why?” The quality of guiding questions directly impacts the quality of responses and interactions between students. As evidence shows, the questions initiating online discussion also play an important role in the type of cognitive activity present in online discussions (Arnold & Ducate 2006).

Activity 1: Research

For this activity, students take a 10-15-minute walk in their local neighborhood, and they note the type and location of all advertisements they encounter (on bus shelters, billboards, newspaper boxes, bike racks, people’s clothes, shopping carts, buses, and so on). They then share their Google Map coordinates and a screenshot to highlight their selected route and share their findings with the rest of the class using Google Presentation. Students then form groups of four in a threaded discussion group to further examine one another’s Advertisement (Ad) Walks. Throughout this activity, students should be encouraged to use a selection of knowledge sources such as libraries, museums, and email exchanges with industry professionals. Asking students to engage in learning with activities such as Ad Walks places them in the center of their learning so “teachers will no longer be [seen as] the only source of expertise” or the only resource (Sawyer 2008, 8). Next, students are asked to consider the target audience for the ads and speculate on the rationale for the location of advertisements (i.e. advertisements targeted at teens are often located close to high schools and shopping malls). In a threaded discussion with teacher prompts, students should have an opportunity to examine the difference in advertising tactics on reservations, in rural, suburban, and urban environments; hence sharing “their situated experiences and knowledge with one another (Dare 2011,10).

Dewey (1916) argues that learning results from our reflections on our experiences as we endeavor to make sense of them; therefore, students should also be asked to compare and comment on the extent of media advertisements in their own homes (internet, television, magazines, radio etc.) and reflect on their findings using the blog and guided questions prepared by the teacher. The teacher should also ask students to read at least two student blog posts and to post comments on each other’s reflections. This activity is intended to increase student motivation and provide authenticity to the learning process, as students will know that there is an active online audience for the online artifacts they are creating (Resnick 1996). The use of technology and other cultural tools (to communicate, exchange information, and construct knowledge) is fundamental in constructivism because as Vrasidas (2000, 7) argues “knowledge is constructed through social interaction and in the learner’s mind.”

Activity 2: Connecting Media Concepts

At the beginning of the course, students should be given the choice to select a unit that holds particular interest to them. In small groups (3-4), they are then given the responsibility for creating a mind map that demonstrates the connections and intersections of new concepts they have been exposed to. Using a mind map, the student groups work collectively to define each of the concepts and identify and illustrate connections among meanings. For example, the unit highlighted in this paper introduces stealth advertising and product placement. These concepts can be connected by their approach; both are non-traditional forms of advertising and are often embedded in other forms of media that contain covert messaging (see figure 3 for student exemplar). Mind mapping tools such as Lucidchart can be located in Google Docs add-ons. Teachers are encouraged to review all the add-on features and extensions that will best suit the needs of their students.

This image is a student examplar of a mindmap created on Lucidchart mindmapping software. The main concept, media messages, is at the centre. Radiating out from media messages are three concepts: targeted advertising, product placement, and stealth advertising. Connected to each of the three terms are examples of student-generated definitions for each.

Figure 3. Mind map student exemplar that demonstrates the connections and intersections of new concepts they have been exposed to.

This ongoing constructed resource shifts and grows throughout the course as students manipulate the document to build new meanings together. This nurtures the collective cognitive responsibility of the class, whereby “responsibility for the success of a group effort is distributed across all the members rather than being concentrated in the leader” (Scardamalia 2002, 2). The students are made responsible for their own learning and should ensure that their classmates “know what needs to be known” (ibid.). This is a particularly effective way for knowledge-building communities to form and grow because collaborative activities need to involve the exchange of information and the design and construction of meaningful artifacts for learners to construct and personalize the knowledge (Resnick 1996). To consolidate and distribute learning, this activity should be repeated for each of the five units in the course.

Part Two: Decoding Media Messages

Lesson 2

In this lesson, students explore the values and beliefs hidden behind advertising messages by analyzing a selection of print, audio, and video advertisements. Students watch an introductory video on “values and media messages” on YouTube (created by the teacher). The teacher video should contain an explanation of how the two media frameworks used throughout the course (The Eight Key Concepts of Mass Media and the Eddie Dick Media Triangle; See figure 4) and how they pertain to decoding and deconstructing advertising and marketing messages. The video provides an introductory explanation of the concepts being discussed in the course and adds important elements of teaching presence such as focusing discussion, sharing meaning, and building knowledge (Garrison et al. 2001). Both frameworks should be made available in the class Google Docs folder titled Administration.

To further their understanding of the constructed nature of media advertisements, students are also asked to watch the Dove Evolution Commercial on YouTube, along with one of the parodies for the Dove Evolution Commercial that can also be found on YouTube. Using their online journals, students then write a reflection on their personal reaction to both the commercial and a Dove parody video, and then identify some of the key elements found on the Media Triangle to arrive at intended and unintended meanings. Online journaling is considered an aspect of cognitive presence, defined as “the extent to which learners are able to construct and confirm meaning through sustained reflection and discourse” (Garrison & Arbaugh 2007, 161) in which students work through the stages of inquiry and arrive at their own meanings through reflective practice.


This is a diagram depicting the Eddie Dick Media Triangle. At the centre of the diagram is a triangle shape with the term "media messages" inside. Outside of the triangle are three concepts: production, audience, and text. There are three double-headed arrows just outside of the triangle to signify the interconnectedness of the three concepts. Below each of the concepts are corresponding questions intended to assist students in media deconstruction activities. An example of such questions is, "in what ways does this text tell a story? Does it connect to a larger story?"

Figure 4: The Key Concepts of Mass Media and the Eddie Dick Media Triangle. Adapted from http://frankwbaker.com/mediatriangle.htm

Activity 3: Group Presentation

Through discussion in small groups using Google Circles, students deconstruct one advertisement of their choice to be presented to the class using the prompts on the Media Triangle handout. The objective is for students to deepen their awareness and understanding about the explicit and implicit values and meanings associated with their selected advertisement. The use of Google Circles enables the teacher to view what is being discussed and provides the necessary scaffolding (Vygotsky 1978) for the learners to continue to extend their ZPD. Furthermore, working in groups on collaborative activities facilitates social presence in online courses as it enables learners to “project themselves socially and emotionally” (Garisson & Arbaugh 2007) and develop a sense of community and improve and practice “real life” working relationships in online courses.

Using Google Presentation feature, students upload their work in a shared folder in Google Drive for the rest of the class to evaluate. In an asynchronous exercise, students are asked to view all presentations (about 4-5) and offer a critique for each work in Google Circles. Having peers critique group presentations produces further insights/perspectives the group may have overlooked or not recognized. As a result, students are more likely to gain a deeper understanding from “the expertise (knowledge and skills), perspectives and opinions” of their peers and “draw from each other’s strengths” and “make use of each other’s abilities” (Hung & Chen 2001, 7) to help construct knowledge.

Activity 4: Reflection

Using their blogs, each student repeats the process of activity 3 using a media advertisement that has personal relevance or meaning. Students also respond to guided prompts such as, “Explain one way the advertisement communicates to its audience and what one resulting meaning is for you.” Dewey states that “learning results from our reflections on our experiences, as we strive to make sense of them” (Russell 1999, 2); and through reflection, students “externalize and articulate their developing knowledge, [and] they learn more effectively” (Sawyer 2008, 7).

Activity 5: Parody Advertisement Media Production

In this activity, students work either in pairs, independently, or in a small group to create of a parody advertisement. Using their new knowledge about advertising strategies and their understanding of the media construction frameworks from prior activities, students deconstruct one parody advertisement and then create their own media artifact with a focus on branding: for example, a parody print advertisement of their own, a short commercial, a radio jingle, or an audiovisual slideshow.

To introduce the concept of branding, students view a four-minute segment of the award-winning Canadian documentary, The Corporation. In this segment, Canadian activist Naomi Klein discusses the impact of corporate branding on individuals and culture (Note: This YouTube video is a legal chapter segment shared online by The Corporation Director Mark chbar). In a threaded discussion on Google Circles, the teacher prompts discussion by asking students what comes to mind when they hear the terms ‘brand’ or ‘branding,’ and what they think about the video.

Students should also be provided with the following definitions:

Branding: the process involved in creating a unique name and image for a product in the consumer’s mind, mainly through advertising campaigns with a consistent theme. Branding aims to establish a significant and differentiated presence in the market that attracts and retains loyal customers. (Business Dictionary, n.d.)

Corporate branding: An attempt to attach higher credibility to a new product by associating it with a well-established company name. Unlike a family-branding (which can be applied only to a specific family of products), corporate branding can be used for every product marketed by a firm. (Business Dictionary, n.d.)

As a class, students examine the iconic brand Nike. The teacher forms small groups of students who have not yet worked together and these groups develop responses to the following questions adapted from lessons available on the Association for Media Literacy (AML) website. This can be completed on a collaborative document in Google Docs and later transferred to the threaded discussion to share with the rest of the class. Students respond to the following prompts:

  • List the positive (intended), neutral, and negative values/ messages that come to mind when considering the brand, Nike. (Responses may range from: cool, stylish, youthful, attractive, wealthy, iconic, patriotism and child labor, mass production and the environment, human rights violation, etc.).
  • Using the Media Triangle framework, how does Nike portray their intended values?
  • How have you been informed about the neutral and negative values?

When students have completed the responses in their small groups, they share their findings with the rest of the class on the threaded discussion and respond to other groups.

Students will then explore the concept of parody advertisements using a Nike Adbusters parody advertisement (see figure 5).

A photograph of Tiger Woods the golfer in his Nike branded cap and top on the left. On the right, a photoshopped photograph of Tiger Woods in a suit with the Nike 'swoosh' Logo behind him that looks as if it is going through his head, and his smile has been photoshopped into the Nike 'swoosh' logo.

Figure 5: Nike vs. Tiger Woods: Image shows two different photographs of Tiger Woods. Adapted from: http://www.adbusters.org/spoofads/unswooshing/

As a reflection assignment to be completed on their blogs, the teacher asks students to consider the following statement from the Association of Media Literacy:

Parody advertisements are a fun way to analyze popular advertisements, especially advertisers who are selling products, which have social and political implications. When you spoof an advertisement, you take elements of the message that give it power and turn the message around to show that it is ridiculous or even untrue. (Association for Media Literacy, March 25, 2017)

Reflection Questions:

  • What elements make this a parody advertisement?
  • What was the first thing you noticed about the advertisement, what is being made fun of? Why is humor an effective way to make a point?
  • What elements are different or the same compared to the real advertisement? (see codes and conventions on Media Triangle Framework)
  • Does the parody advertisement change how you perceive the original advertisers?
  • What is the value message in this parody advertisement? If you could write a statement message for the parody advertisement, what would it be (2-3 sentences)?

To further distribute knowledge, learning, and social and cognitive presence, students are then asked to comment on a student blog they have not visited during the course. As Cole and Engestrom (1993, 15) reason, one person cannot contain all the knowledge or culture of the group that they identify with, thus knowledge can and should be, “distributed among people within a cultural group.”

With background experience in branding and the parody advertisement critique experiences now in place, students are well prepared for the final activity: the creation of a parody advertisement. Students form groups or pairs based on their personal interests (radio jingle, video, magazine advertisement, website etc.). As Resnick (1996) argues, when personally meaningful artifacts are constructed, new knowledge is constructed with greater effectiveness. Students should be encouraged to use freely accessible Google+ applications such as Pixlr (image editing), UJAM (audio editing) and Magisto (video editing). By having students use popular applications from their own cultural context, the task is rendered more authentic, lessening the often ‘transmuted’ activities students may experience in school (Brown, Collins & Duiguid 1989). Student groups create a Google Community to carry out the following tasks:

  • Select a brand to spoof (ideas can be found on Adbusters website)
  • Identify the intended values and value messaging of the brand and their advertisements
  • Select the new value message the group wishes to convey and create a slogan or tagline
  • Using Google+ applications and tools, create parody advertisement in the Google Community.

Once the parody advertisements have been completed, each group signs up for a synchronous video conference with the teacher using Google Hangouts (up to nine participants) to take part in a group critique of their work. Students working independently can be grouped into one critique group. Other students will be encouraged to attend the Google Hangouts session which should also be recorded for students who wish to view the critique afterwards, as well as for teacher evaluation and assessment.

Conclusion

This paper has considered online learning from a constructivist perspective and applied a selection of the key concepts and ideas of influential constructivist thinkers to the design of an online media studies course for 11th graders studying in Ontario. The affordances Google Drive offers to constructivist pedagogic practice have been shown to be numerous. The integrated nature of the suite of applications and the communication, sharing, presentation and administration possibilities the software affords educators planning an online course make Google Drive a very useful pedagogic tool. The central idea of constructivism—that knowledge is constructed in people when incoming information meets and integrates with their existing experience and knowledge—has been discussed and illustrated using authentic current curriculum documents and teaching activities.

To encourage and facilitate constructivist learning, well thought out, student-centered learning tasks and activities that leverage the various affordances of the technology need to be devised, monitored, reviewed, and added to, to ensure the learning experiences of students and educators constantly extend. The construction of knowledge is both an individual and group endeavor that changes from moment to moment and from an educational perspective from course to course. Individual learners that make up the community of any course shape its conversations, its direction, and consequently the learning that happens within it. The fluid nature of this kind of learning makes it an engaging and stimulating way to learn. It is the work of online learning designers to ensure that when they are making pedagogical decisions that they fully exploit the affordances of the technology they use to promote student-centered activities that nurture and sustain learner engagement and stimulation.

Bibliography

Arnold, Nike, and Ducate, Lara. 2006. “Future Foreign Language Teachers’ Social and Cognitive Collaboration in an Online Environment.” Language Learning & Technology 10:1, 42-66. Accessed October 6, 2016. http://llt.msu.edu/vol10num1/pdf/arnoldducate.pdf.

Bereiter, Carl. 1997. “Situated Cognition and How to Overcome it.” In Situated Cognition: Social, Semiotic, and Psychological Perspectives, edited by David Kirshner and James Anthony Whitson. Psychology Press.

Brown, John Seely, Allan, Collins and Duguid, Paul. 1989. “Situated Cognition and the Culture of Learning.” Educational Researcher 18:1, 32-42.

Boettcher, Judith. V. 2007. “Ten Core Principles for Designing Effective Learning Environments: Insights from Brain Research and Pedagogical Theory.” Innovate: Journal of Online Education, 3:3, 2. Accessed October 6, 2016. http://nsuworks.nova.edu/cgi/viewcontent.cgi?article=1099&context=innovate.

Bruner, Jerome S. 1996. The Culture of Education. Harvard University Press.

Business Dictionary (n.d). Branding. Accessed October 6, 2016. http://www.businessdictionary.com/definition/branding.html.

Cole, Michael, and Engeström, Yrjö. 1993. “A Cultural-Historical Approach to Distributed Cognition.” In Distributed cognitions: Psychological and Educational Considerations, edited by Gavriel Salomon, 1-46. NY: Cambridge University Press.

Dare, Alexa. 2011. “(Dis) Embodied Difference in the Online Class: Vulnerability, Visibility, and Social Justice.” Journal of Online Learning and Teaching 7:2, 279-287. Accessed October 6, 2016. http://jolt.merlot.org/vol7no2/dare_0611.htm.

Dewey, John. 1916. Democracy and Education. The Free Press: New York.

Dillon, Patrick, Wang, Ruolan and Tearle, Penni. 2007. “Cultural Disconnection in Virtual Education.” Pedagogy, Culture & Society 15:2, 153-174. Accessed October 6, 2016. http://dx.doi.org/10.1080/14681360701403565.

Garrison, D. Randy, Anderson, Terry, and Walter Archer. 2001. “Critical thinking and computer conferencing: A model and tool to assess cognitive presence.” American Journal of Distance Education 15: 7-23.

Garrison, D. Randy, and J. Arbaugh, Ben. 2007. “Researching the Community of Inquiry Framework: Review, Issues, and Future Directions.” The Internet and Higher Education 10:3, 157-172.

Huang, Hsiu‐Mei. 2002. “Toward constructivism for adult learners in online learning environments.” British Journal of Educational Technology 33:1, 27-37.

Hung, David WL, and Chen, Der-Thanq. 2001. “Situated Cognition, Vygotskian Thought and Learning from the Communities of Practice Perspective: Implications for the Design of Web-Based E-learning.” Educational Media International 38:1, 3-12.

Lave, Jean, and Wenger, Etienne. 1991. Situated Learning: Legitimate Peripheral Participation. Cambridge University Press.

Luebeck, Jennifer L., and Bice, Lawrence R. 2005. “Online discussion as a mechanism of conceptual change among mathematics and science teachers.” Journal of Distance Education 20:2, 21-39.

Lulee, Su Tuan. 2010. “Basic Principles of Interaction for Learning in Web-based Environment.” Educause Review 7:2 1-32. Accessed October 6, 2016. http://www.educause.edu/sites/default/files/Basic%20Principles%20of%20Interaction%20for%20Learning%20in%20Web-Based%20Environment%20-%20feedback%20from%20Fahy-revised.pdf.

Moore, Michael, G. 1989. Three Types of Interaction. The American Journal of Distance Education 3:2, 1-6. Accessed October 6, 2016. http://dx.doi.org/10.1080/08923648909526659.

Michinov, Nicolas, Michinov, Estelle, and Toczek-Capelle, Marie-Christine. 2004. “Social Identity, Group Processes, and Performance in Synchronous Computer-Mediated Communication.” Group Dynamics: Theory, Research, and Practice 8:1, 27-39.

Pea, Roy D. 1993. “Practices of Distributed Intelligence and Designs for Education.” In Distributed Cognitions: Psychological and Educational Considerations. Edited by Gavriel Salomon, 47-87. NY: Cambridge University Press.

Piaget, Jean. 1973. To Understand is to Invent: The Future of Education. Grossman, New York.

Quinton, Stephen, R. 2010. “Principles of effective learning environment design.” In Looking Toward the Future of Technology-enhanced Education: Ubiquitous Learning and the Digital Native, editors Martin Ebner, Mandy Schiefner ,327-352. IGI Global.

Resnick, Mitchel. 1996. “Distributed Constructionism.” In Proceedings of the 1996 International Conference on Learning Sciences, 280-284. International Society of the Learning Sciences.

Russell, B. 1999. “Experience–Based Learning Theories. The Informal Learning Review. Informal Learning Experience.” Informal Learning Website. Accessed October 6, 2016. http://www.informallearning.com/archive/1999-0304-a.htm.

Salomon, Gavriel. 1993. Distributed Cognitions: Psychological and Educational Considerations. Cambridge: Cambridge University Press.

Scardamalia, Marlene. 2002. “Collective Cognitive Responsibility for the Advancement of Knowledge.” In Liberal Education in a Knowledge Society, edited by Barry Smith, 67-98. Chicago: Open Court.

Sawyer, R. Keith. 2008. “Optimising Learning Implications of Learning Sciences Research.” In Innovating to learn, learning to innovate, edited by Centre for Educational Research and Innovation.Organisation for Economic Co-operation and Development. 45-65.

Simpson, Raymond. J., and Galbo, Joseph. J. 1986. Interaction and Learning: Theorizing on the art of teaching. Interchange, 17:4, 37-51.

Ontario Ministry of Education. 2007. The Ontario Curriculum Grades 11-12: English (Revised). Accessed from http://www.edu.gov.on.ca/eng/curriculum/secondary/english1112currb.pdf.

Vrasidas, Charalambos. 2000. “Constructivism Versus Objectivism: Implications for Interaction, Course Design, and Evaluation in Distance Education.” International Journal of Educational Telecommunications 6:4, 339-362. Accessed October 6, 2016. http://vrasidas.com/wp-content/uploads/2007/07/continuum.pdf.

Vygotsky, Lev Semenovich. 1978. Mind in Society: The Development of Higher Psychological Processes. Harvard University Press, Cambridge, USA.

About the Authors

Chris Harwood has taught English for academic purposes, and writing composition for over 20 years in high schools and universities around the world. He recently completed a PhD in Language and Literacies Education at OISE, University of Toronto, and is currently teaching critical reading and writing in Japan.

Alison Mann is an award-winning media and film educator with over 18 years of teaching experience. She is currently pursuing a PhD. at the University of Toronto focusing on critical media literacy, online learning environments at the secondary level and intercultural communication.

4

Care, Convenience, and Interactivity: Exploring Student Values in a Blended Learning First-Year Composition Course

Abstract

Blended learning (BL) represents one of fastest growing instructional models as an alternative to traditional face-to-face pedagogy. Convenience, interactivity, instructor availability, and classroom community are elements of blended learning environments most often associated with student satisfaction. These elements of student satisfaction all share an innate relational quality that can be understood through the framework of an ethics of care. Through ethnographic analysis, this study seeks to add to this literature by emphasizing the relational aspects of BL and the need to understand students’ experiences through the framework of care. To illustrate the use of this framework in the context of BL, this study explores how college students engage with and make sense of technology in the context of their first college course. Thematic analysis of students’ qualitative responses to interviews and a class survey revealed that students in the course largely valued elements generally associated with care, such as interactive feedback, instructor availability, and freedom of expression. Consistent with the literature, students also valued convenience and interactivity, which in this analysis were also conceptualized through the framework of care. The participants in this study were mostly non-traditional college students (e.g., low-income, minority, commuter). This article argues that understanding the effects of specific online and face-to-face practices on students’ perception of care may prove crucial in designing effective and engaging BL environments.

In a brand-new, tiered classroom, four semi-circle rows of desks cascaded downward, each chair bolted to the floor in front of a desk with just enough room to allow students to slip in and out. A pop-up outlet sat in front of each chair. This space implied a non-interactive pedagogy rooted in expert-to-novice transmission of knowledge. Situated in the middle of the classroom, a professor would deliver a lecture, while students would take notes diligently, many on their plugged-in devices. Group work and other pedagogies of deep student engagement would struggle to thrive in such a space. Here they sat, twenty-seven entering freshmen at one of the eight senior colleges at the City University of New York (CUNY), the largest urban, public university in the country. Paper notebooks and ballpoint pens were the only objects populating students’ desks, with the instructor’s laptop being the only visible electronic device. An ethnographer sitting in the last row, I began typing my notes, documenting these students’ first experiences with college composition and, for some, blended learning.

Blended learning (BL) encompasses teaching models that combine “face-to-face instruction with computer-mediated instruction” (Graham 2006, 5). Following recent calls to cut costs and engage students with “21st century skills,” the growth of BL instruction across educational contexts has led some scholars to call it the “new normal” of course delivery (Norberg, Dziuban, and Moskal 2011, 207). Despite its growing popularity, BL remains an understudied area compared to distance learning and face-to-face pedagogy (Graham 2013). The most impactful literature in BL is theoretical, focusing on the “definitions, models, and potential of blended learning” (Halverson, et. al 2012, 397) with the majority of empirical work focusing on student outcomes (Halverson, et. al 2012). Osguthorp and Graham (2003) identify pedagogical richness, access to knowledge, social interaction, personal agency, cost-effectiveness, and ease of revision as major goals of blended learning.

Given that BL models are relatively new, a growing segment of the empirical research on BL evaluates student satisfaction as a proxy for students’ ability to navigate new learning environments (Moore 2005). Indeed, BL models correlate positively with high levels of satisfaction (Vignare 2007; Graham 2013). Common factors contributing to student satisfaction include interactivity, convenience, flexibility, feedback, and instructor availability (e.g., Bonk, Oslon, Wisher, and Orvis 2002; Dziuban, et. al 2010; Mansour and Mupinga 2007), with interactivity, face-to-face or digital, standing out as particularly significant. For instance, Akkoyunlu and Soylu (2008) found that students, on average, identified a course’s face-to-face elements as the most significant contributors to their satisfaction. Rothmund (2008) found that learner satisfaction correlated strongly with degree of interaction. Similarly, Akyol, Garrison, and Orden (2009) found that students in BL models valued social and teaching presence.

Although student satisfaction surveys can often take the form of marketing research, interactivity and many other factors associated with student satisfaction share a critical quality: relationality. For instance, Garrison (2009) defines social presence as “the ability of participants to identify with the community (e.g., course of study), communicate purposefully in a trusting environment, and develop inter-personal relationships by way of projecting their individual personalities” (352). Similarly, effective feedback, teaching presence, and instructor availability contextualize the relationship between student and instructor. Moreover, I argue that the effectiveness of such relationships, in part, relies on students’ perception of care.

An ethic of care represents one of the key elements of teaching due to its potential to increase students’ motivation and engagement across various learning environments. As a pioneer of this concept, Noddings (1984/2003), identifies caring as, “the primary aim of every educational institution” (172). For Noddings (1984/2003), caring is grounded in the relational, context-specific practice of anticipating another’s needs, fostering an open dialogue, and “apprehending the other’s reality” (16). Similarly, Rauner (2000) defines care as “an interactive process involving attentiveness, responsiveness, and competence” (7). Tronto (1993) further emphasizes the contextual and relational nature of care by arguing for the importance of direct proximity between the carer and cared-for to produce genuine and effective care. Moreover, an extensive research literature in traditional instructional models and school organization links care to better student outcomes and healthy development (e.g., Rauner 2000; Noddings 2013; Goldstein 2002; Cassidy and Bates 2005).

Despite robust research on care in traditional instructional models, its discussion is largely absent from the BL and online education literature. The limited existing research on care in fully online environments suggests that students associate care with timely feedback, personal comments, multiple contact opportunities, personal connection, and commitment to learning (Zitzman and Leners 2006; Marx 2011). Similarly, Deacon (2012) argues that using technology to anticipate and alleviate student anxiety while building a sense of community creates a caring environment in an online course. These findings suggest that many of the factors associated with student satisfaction in BL may be associated with students’ perception of care, yet the existing literature does not engage with those concepts as such.

Through empirical analysis, this paper seeks to add to this literature by emphasizing the relational aspects of BL and the need to understand students’ experiences through the framework of care. Understanding the effects that specific online and face-to-face practices have on students’ perception of care may prove crucial in designing effective and engaging BL environments. In this ethnographic study, I explore how college students engage with and make sense of technology in the context of their first college course. The participants in this study were mostly non-traditional college students (e.g., low-income, minority, commuter), who are often underrepresented in the digital education literature. Foregrounding student voices (Cook-Sather 2002), I focus my analysis on understanding students’ values and the role of care in the voicing of their experiences in the course.

Methods

The ethnographic design of this study included multiple methods of data collection: 30 classroom observations, four 30-minute semi-structured interviews, and a class survey. Interview questions aimed to explore student experiences with and perceptions of various elements of course design as outlined by the instructor in a teaching journal and course syllabus. A 24 question survey was designed based on the initial themes that emerged in the interviews. Twelve students (44% of the class) participated in the survey. In both the interviews and the survey, students were asked about their previous experiences with digital tools, present course practices, and their overall impression of the course. Some of the open-ended questions included: (1) “How does it make you feel knowing that all your work is continuously shared with your instructor digitally?” (2) “In your opinion, are there any advantages to digital comments over traditional pen and paper comments on your work? Why?” and (3) “In what ways (if any) did you find having a course blog/forum (un)helpful?” Additionally, 15 students volunteered their course work for analysis, and the instructor provided a copy of his teaching journal. To facilitate recruitment, I introduced myself and described the project at the beginning of the course. When asked, none of the students expressed discomfort with my continuous presence in a classroom.

To ensure students’ confidentiality, all recruitment activities and communication were conducted without the instructor’s presence. Informed consent was provided for all research activities. To build a caring and productive relationship with the students, I volunteered to provide feedback on their major writing assignments irrespective of their agreement to participate in the study.

Curriculum

The observed course curriculum represents a supplemental model of BL (Graham 2013). A traditional 15 week 45 hour English composition course was supplemented with a course forum, a digital assignment submission and revision system, and the application of digital tools, such as Prezi. Hosted on Google Sites through an embedded instance of Google Groups, the forum extended classroom space beyond the physical room. According to the instructor, the forum served as a space of modeling and collaborative learning: “In the forum, all of my students have the opportunity to follow each other’s ideas, respond to one another, and collectively generate ideas” (Instructor’s Journal).

Another element of this supplemental model included the use of Google Docs for collaborative annotation of class readings and delivery of digital feedback. Throughout the semester, students shared their work with the instructor through Google Drive folders, which served as their final portfolios. According to the instructor, this assignment submission method and the interactivity of digital feedback, aside from being convenient, reinforced the lessons that writing is a collaborative and continuous process. The instructor required students to use Prezi to compile annotated bibliographies. As a blank canvas, Prezi provided students with the flexibility to organize their sources in ways conceptually meaningful to them while breaking the rigidity of a more traditional alphabetical structure. Overall, this curriculum utilized computer-instruction for both course management and community building purposes, while using particular digital tools for their ability to reinforce lessons about the writing process.

Participants

Twenty-seven students registered for the course. A total of 16 students participated in the study: 12 completed the survey and 4 were interviewed, with no overlap. Nine of the participants were 18; two were 19, and one did not provide their age. Twelve were female and 4 male. Out of the 12 survey participants, 5 (42%) were Latina/Latino, 3 (25%) Caucasian, 3 (25%) Black, and 1 (8%) Mixed race. Five reported working 0 hours per week, while 7 worked between 12 to 35 hours per week.

Overall, they were representative of the college’s freshman class, of whom 43% were male and 57% female, 42% were Hispanic, 25% White, 14% African American, 12% Asian and 1% Native American. Ninety-three percent of the entering class received federal financial aid.[1] Eleven out of 12 students reported having access to a computer and Internet at home. Yet, class observations data showed that only 3 students brought laptops to class and 2 students used tablets. Other students used their mobile phones to engage with digital elements of the course during class time. Out of 16 participants, 4 reported having no prior experience with course websites, 5 reported no prior experience with Prezi, and 3 reported no prior experience with Google Docs. To protect student identities, I use pseudonyms when referring to their responses.

Analysis

Following Braun and Clarke’s (2006) framework for thematic analysis, I employed a data-driven inductive approach to identify themes present in students’ qualitative accounts of their course experiences in the interviews and open-ended survey questions. I focused my analysis on themes associated with student values and elements of the course that they identified as important. While student responses were the primary sources of data, I used field notes and student work to supplement and contextualize these data.

Results

Consistent with existing literature, a majority of participants (15) expressed overall satisfaction with the course. Students found the course to be “outside the box” (Jessica), “very different from any other class” (Maria), and “awesome” (David). A thematic analysis of student experiences revealed that, in their discussion of the digital elements of the course, students tend to put the most emphasis on the elements of care, convenience, and interactivity. Within this analysis, care characterizes students’ interactions with their instructor, convenience is understood as a product of a course designed with careful attention to students’ needs, and interactivity is conceptualized as an opportunity to foster caring relationships among students. Furthermore, a detailed exploration of these themes suggests a complex interaction among the elements of course design, digital tool use, and students’ relational experiences.

Care

The theme of care, broadly speaking, characterizes students’ interactions with their instructor. As a multi-faceted concept, elements of care manifested in the themes of feedback, instructor availability and involvement, and freedom of expression.

Value of Feedback

In online learning environments, students tend to associate timely feedback with care (Zitzman and Leners 2006; Marx 2011). In their interviews, survey responses, and reflective letters (one of the course assignments), students in this study placed value on their ability to receive feedback, suggesting a perceived value of care. When asked about their attitude toward having their work continuously shared online with their instructor, six out of twelve survey respondents mentioned feedback as a key element of this practice. Jean wrote that sharing work online with the instructor “gives me an opportunity to receive feedback.” Similarly, Dana reported being “comfortable [with sharing work] since he is able to always give me feedback.”

Availability and Involvement of the Instructor

Moreover, receiving digital comments and sharing their work online made some students feel like their professor was available and involved, experiences often associated with caring. Expressing that she valued her professors’ availability, Heidi wrote, “he is my first professor but he moves out of his way to meet with us and discuss our papers.” Similarly, Rose noted that digital elements of the course made her feel like the instructor was “very involved in the class” and all the elements of the course were “linked all together.” David clarified this perception of care by interpreting the instructor’s intentions behind digital work: “he probably designed it that way to get a more intimate view of the progress.” According to David, interactive feedback and instructor involvement represented a contrast to the “separate and detached assessment” in other courses. In her survey response, Maria implicitly related digital sharing and comments with care: “I feel like it’s helpful because I know that my instructor is actually reading my work.” Likewise, Bill found digital affordances to be supportive: “it encourages you more when it is so easy to get feedback.” He maintained that the interactivity of digital feedback allowed for an agentic dialogue between him and the instructor, saying that “usually I do respond to his comments or let’s say he’ll have a question and if he is unclear sometime I’ll clarify to him like this is my motive for writing that.” Such dialogue, fostered through digital feedback, became an important experience not only for the students but also for the instructor. In his journal, the instructor noted that digital commenting “emerged as one of the more rewarding digital experiments this semester.” He acknowledged the development of an ongoing dialogue where “students were generally consistent about responding to my feedback in the comment bubbles, and I was therefore able to read their comments and respond yet again” (Instructor’s Journal).

Freedom of Expression

As a part of this dialogue, students valued the freedom of expression that the course’s structure and digital tools fostered. Rose spoke about the freedom of structuring work in Prezi, of it being “like a board so you can zoom out; you can change the shapes of things; you can put many things into that one board, and you can’t do that in a Word document.” David echoed her sentiment, “it’s easy to use; it’s fun the way I can get creative with it, how I want things to connect. When I made an annotated bibliography mine was like the most different from everyone else, like, I saw. Instead of white pages, I had like a galaxy and it was moving around.” Referring to the traditional format of annotated bibliography as “rigid,” Bill stated that, “Prezi allows me to do more because it’s not as rigid as traditional one.”

Valuing freedom of expression also appeared in students’ discussions of the course assignments. In his reflective letter, Peter wrote, “[the proposal] was my favorite project to do because I chose a topic that was very important to me and something that I had an enormous experience with.” When asked about their favorite project, three out of four interviewed students named the literacy narrative, citing its personal nature. Centered on student experiences, the literacy narrative assignment resonated with the students because “it was so personal” (Bill). Bill continued to emphasize that overall the instructor allowed student voices to be heard in the class: “he let’s us voice our own opinions; like today, I shared [an] interview. So I really liked that he like is really open minded and he really listens to all the students in a class.” Juan shared this sentiment in his reflective letter: “I don’t like to participate at all in my other classes, but it was different in this class, you were never really wrong when you said something.”

It is evident from student responses that digital components of the course, namely the digital sharing of work with the instructor and digital commenting, were largely perceived and valued as elements of care. Students valued the opportunity to receive feedback and engage in a dialogue with their instructor. Prompt and interactive feedback afforded by the digital comments was perceived as caring, conveying instructor availability and involvement. Moreover, the emphasis on student expression, whether through digital tools or classroom discussion, can be seen as another element of caring.

Convenience

In addition to these elements of care, students also valued the ease and convenience associated with the digital aspects of the course. In their survey responses, students reported that using Google Docs and the course forum to submit assignments “was easier and more convenient” (Ann) and that it “saved time and money on train rides to [College] and ink” (Beth). Digital submissions made “it easier for me to be able to share my work,” wrote Andrea. For Mary and David, convenience rested on the ability “to type it on the computer and just hand it in through the computer” and to “submit anything at any time,” respectively. While six of the students reported seeing no particular advantages of digital feedback over pen and paper comments, all of the students who found digital feedback more advantageous listed convenience as one of those advantages. With digital comments, students found it easier “to find grammatical errors, spell check, etc.” (Beth) and “to make corrections directly into the work” (Valerie).

While convenience presents itself largely as a utilitarian concept, it can also be conceptualized as an anticipation of students’ needs, a key aspect of caring (Noddings 1984/2003). In this course, the instructor’s knowledge of the student population informed many course design choices, such as requiring digital submissions, providing digital feedback, and avoiding a costly textbook. While reflecting on the digital feedback practices, the instructor wrote, “While time consuming, this structure brings a conversational feel to the revision process without requiring additional in-person work, an important consideration at [Institution], where many students commute long distances and work long hours outside of the school” (Instructor’s Journal). Echoing this sentiment, Rose stated, that “it would take more time for me to go to him and talk to him about the comment and then him reply to me.”

Interactivity and Its Complex Layers

Students also valued the interactivity afforded by the digital elements of the course, a value central to the students’ experiences. Interactivity aids in classroom community building, promoting a caring environment among students. This value represents a complex combination of the perceived communication affordances of the course forum and face-to-face interactions.

Students’ discussions of the course forum focused on communicative and interactive features. For Jessica, having a course forum “made it easier to communicate with the whole class outside of the classroom.” Mary liked “the interaction with everybody.” Reinforcing the value of communication and collaboration, Bill described the course forum as a “really collaborative space.” Similarly, Rose indicated that one of the strengths of the course forum was the ability to share work and “to talk to each other about it.”

From students’ perspectives, the course forum successfully served as a source of modeling and validation. All of the participants valued the ability to see other students’ work to help generate ideas when not sure how to proceed. In her survey response, Linda wrote, “It helped me see everyone’s ideas which I could incorporate into my own.” Similarly, on the forum, Ann was able “to view my classmates’ opinions on the assignment and get a clearer understanding of it.” Beth wrote that, “the course blog helped me do my homework because I got to see examples of others’ before doing mine.” In his interview, David echoed these sentiments: “I do use it to get ideas if I am completely completely stuck.”

Paradoxically, little self-directed collaboration or communication actually occurred on the forum. Communication between students only occurred on the forum when the instructor asked students to comment on each other’s work. Outside of these assignments and contrary to their own responses, students did not engage with the forum as a space for communication. For many, “it was just a homework” (Rose). Further supporting the “just homework” attitude, David responded, “I don’t see it as a thing to reply to; I just see it as just homework.” Because “no one else responds to these posts,” Mary assumed that, “we don’t have to or we should not.” In fact, although students reported communicating with up to 7 classmates sometimes as often as 3 times a week, such communication took the form of emails, text messages, face-to-face communication (in and outside of class), and social media posts. However, none of the 12 students who took the survey listed the course forum as means of communication with their classmates.

Although none of the students reported engaging in self-directed communication with others through the course forum, students reported it as a useful mediator of student interaction that facilitated face-to-face communication. Ten out of 16 participants reported communicating with fellow classmates in person outside of class. Eight of these 10 also reported communicating in class. Some of the students reported that the course forum served as an ice breaker for approaching fellow classmates. For instance, Bill reported that, “sometimes like we will see something on the blog and then we won’t comment about it on the blog directly, but like I’ll see them in class and say ‘hey I really liked your topic.’” He described the forum as giving “us a little bit of incentive especially in like a city school like to communicate more with like your peers.” Similarly, Rose discussed how the course forum allows students to “make friends after a while even by doing homework.” Seeing and engaging with one’s peers’ work online provided a reason to initiate contact “because you are not going to ask someone for their number randomly in class; why would you want my number? So after commenting on your work, you can email them privately if you want and see if you want to meet up.”

Indeed, approximately half of participating students voiced an explicit preference or desire for face-to face communication. For instance, when asked whether in-class peer review can be effectively substituted with an online alternative, 9 out of 13 students responded “No.” Out of those nine, five explicitly stated a preference for face-to-face communication. Beth suggested that online peer review may create more room for miscommunication and would not work “because sometimes you really don’t understand what a person is trying to say.” Bill saw merit in the online peer review model, but still maintained that, overall, face-to-face communication is an important form of classroom interaction because “you are able to see in the class like the emotion of the people or you can see like the enthusiasm of like a person with their topic.” For Bill, the ability to see someone and communicate with them in person corresponded to the ability to “relate to them like physically or their past experience.” The disadvantage of online communication, according to Bill, lies in the potential of losing “your own voice, like the physical voice, not just the words but like someone’s actual personality […] which is why I feel like it’s better to talk in person.”

Overall, students saw perceived interactivity afforded by the course forum as an important part of the course. They emphasized deeply relational aspects of the course design, such as an ability to connect emotionally and intellectually with others. However, at times they contradicted themselves by praising the communicative affordances of the course forum while indicating that they did not engage in self-directed communication through it. Thus, these findings suggest that the true value of the course forum lies in its role as a moderator of student relationships with each other, suggesting its potential effectiveness for building community grounded in mutual caring relationships.

Discussion and Conclusion

In this analysis, I demonstrate how concepts commonly associated with student satisfaction in BL environments can be conceptualized and theorized through the framework of care. Overall, the results of this study are consistent with the existing literature on student satisfaction in BL. For instance, students valued convenience and flexibility, which are almost universally identified as benefits of a blended learning design, both by definition (Graham 2006) and in student responses (e.g., El Mansour and Mupinga 2007). Interactivity — in the form of social presence, community building, and collaboration — represents another element of blended learning commonly linked with student satisfaction and improved outcomes (Garrison 2009; Akyol, Garrison and Orden 2009). However, these findings also reinforce the existing framework of care. Both Noddings (1984/2003) and Rauner (2000) situate care in responsiveness, anticipation of other’s needs, and open dialogue. In this case, the instructor’s pedagogical choices demonstrate an awareness of students’ needs, contributing to students’ perception of convenience. Overall, the instructor created assignments that encouraged interactivity and freedom of expression, building a culture of care and a sense of community in a classroom. These practices resist the static physical design of the classroom and the implications of that design on pedagogy. Care, in turn, represents an important component of student experience by fostering trusting relationships and encouraging student perseverance, particularly in students at risk of dropping out (Cassidy and Bates 2005).

Implications for the Instructors

Emphasizing care in BL course design shifts the discussion from cost effectiveness to human relations. It foregrounds both the importance of considering students’ needs and the deeply relational nature of the learning process, regardless of the mode of delivery. Moreover, emphasizing care takes on greater importance when working with non-traditional college students, particularly first-generation, low-income, and minority students, who might have limited social support. For instance, Roberts and Rosenwald (2001) found that first-generation college students often experience “value clashes and communication difficulties” (99) with their parents, other family members, and friends. These fracturing social relations may take a psychological toll and impact students’ retention. Pedagogies that project care may go a long way in encouraging perseverance by helping these students genuinely engage in the learning process.

In practice, instructors should begin by learning about students’ needs and the local institutional context. Consulting available institutional data and/or conducting a brief survey prior to or during the first week of class to learn about students’ prior experiences with instructional technology, access to technology, and outside-of-class obligations might help instructors adjust their course design to better address the needs of a given class. For example, at CUNY, many students use their cell-phones to engage with the digital elements of their courses (Smale and Regalado 2014). This trend is not surprising considering that CUNY largely serves working class and low-income students. According to Pew Research Center’s project on Internet, Science & Technology, working class and low-income youth often rely solely on a phone data plan for Internet access (Smith 2015). The level of access within a given class, however, may be difficult to predict. In an institution as large and diverse as CUNY, class-level access to technology may vary based on college, time schedule, and program of study, among other factors. Fortunately, in this study, nearly all of the surveyed students had access to the Internet and a computer at home. Yet, throughout the semester, the vast majority of the class as a whole used cell-phones to engage with digital elements of the course during class time. In cases like this, using platforms that are not readily compatible with a wide range of operating systems may impede students’ ability to successfully engage with their class.

Students’ personal access to technology should also be evaluated in light of resources provided by the institution. Digital labs on campus and laptop loan services may supplement personal access, allowing instructors to utilize a larger range of platforms. Moreover, students themselves may be unaware that such programs exist, and instructors can bridge gaps between institutional affordances and students’ awareness. Nevertheless, an instructor teaching an evening class, for example, where most students work full time should be mindful of some students’ inability to take advantage of campus resources. Thus, a care-centric pedagogy must always specifically engage with the context of the individual classroom as well as the local institution.

Instructors can foster interactivity and build community by designing assignments and choosing platforms that promote an open dialogue among the students and extend interactive classroom spaces rather than digitally replicating individualistic, isolationist homework. In this study, students did not actively engage in the forum as a communication platform, but were able to relate each other’s posts to classroom discussions, a practice potentially fostered by the free choice of study topics. In other words, a successful BL curriculum accounts for the interdependence of various elements of the course, where the ethics of care and strong pedagogical principles are supplemented and reinforced by digital tools, but not replaced by them. The potential effectiveness of such a curriculum reaches beyond the immediate learning objectives of a course and may contribute to college success and degree completion. Developing a pedagogy of care offers great potential to foster student development, and blended learning environments possess substantial affordances to develop and enhance such a pedagogy.

Notes

[1] These statistics are taken from a report by the Office of Institutional Research and Assessment, but to ensure the confidentiality of the participants, the name of the college and relevant documents can be revealed only upon request to the author.

Bibliography

Akkoyunlu, Buket, and Meryem Yilmaz-Soylu. 2008. “A Study of Student’s Perceptions in a Blended Learning Environment Based on Different Learning Styles.” Educational Technology & Society 11, no. 1: 183-193.

Akyol, Zehra, D. Randy Garrison, and M. Yasar Ozden. 2009. “Online and Blended Communities of Inquiry: Exploring the Developmental and Perceptional Differences.” The International Review of Research in Open and Distributed Learning 10, no. 6: 65-83.

Bonk, Curtis J., Tatana M. Olson, Robert A. Wisher, and Kara L. Orvis. 2002. “Learning from Focus Groups: An Examination of Blended Learning.” International Journal of E- Learning & Distance Education 17, no. 3: 97-118.

Braun, Virginia, and Victoria Clarke. 2006. “Using Thematic Analysis in Psychology.” Qualitative Research in Psychology 3, no. 2: 77-101.

Cassidy, Wanda, and Anita Bates. 2005. “‘Drop-Outs’ and “Push-Outs’: Finding Hope at a School That Actualizes the Ethic of Care.” American Journal of Education 112, no. 1: 66-102.

Cook-Sather, Alison. 2002. “Authorizing Students’ Perspectives: Toward Trust, Dialogue, and Change in Education.” Educational Researcher 31, no. 4: 3-14.

Deacon, Andrea. 2012. “Creating a Context of Care in the Online Classroom.” The Journal of Faculty Development 26, no. 1: 5-12.

Dziuban, Charles, Patsy D. Moskal, George R. Bradford, Jay Brophy-Ellison, and Amanda T. Groff. 2010. “Constructs that Impact the Net Generation’s Satisfaction with Online Learning.” In Rethinking Learning for a Digital Age, edited by Rhona Sharpe, Helen Beetham, and Sara De Freitas, 56-71, New York: Routledge.

Garrison, D. R. 2009. “Communities of Inquiry in Online Learning.” Encyclopedia of Distance Learning 2: 352-355.

Goldstein, Lisa S. 2002. Reclaiming Caring in Teaching and Teacher Education. Peter Lang Publishing Inc.

Graham, Charles R. 2006. “Blended Learning Systems.” In The Handbook of Blended Learning, edited by Curtis J. Bonk and Charles R. Graham, 3-21. San Francisco: Pfeiffer.

Graham, Charles R. 2013. “Emerging Practice and Research in Blended Learning.” In Handbook of Distance Education, edited by Michael G. Moore, 333-350. New York: Routledge.

Halverson, Lisa R., Charles R. Graham, Kristian J. Spring, Jeffery S. Dziuban, and Charles Drysdale. 2012. “An Analysis of High Impact Scholarship and Publication Trends in Blended Learning.” Distance Education 33, no. 3: 381-413.

El Mansour, Bassou, and Davison M. Mupinga. 2007. “Students’ Positive and Negative Experiences in Hybrid and Online Classes” College Student Journal 41, no. 1: 242.

Marx, Gina R. 2011. “Student and Instructor Perceptions of Care in Online Graduate Education: A Mixed Methods Case Study.” PhD diss., Wichita State University.

Moore, Janet C. 2005. “A Synthesis of Sloan-C effective Practices.” Journal of Asynchronous Learning Networks 9, no. 3: 5-73.

Noddings, Nel. 1984/2003. Caring: A Feminine Approach to Ethics and Moral Education. University of California.

Noddings, Nel. 2013. Caring: A Relational Approach to Ethics and Moral Education. University of California Press.

Norberg, Anders, Charles D. Dziuban, and Patsy D. Moskal. 2011. “A Time-Based Blended Learning Model.” On the Horizon 19, no. 3: 207-216.

Osguthorpe, Russell T., and Charles R. Graham. 2003. “Blended Learning Environments: Definitions and Directions.” Quarterly Review of Distance Education 4, no. 3: 227-33.

Rauner, Diana Mendley. 2000. They Still Pick Me Up When I Fall: The Role of Caring in Youth Development and Community Life. Columbia University Press.

Roberts, Scott J. and George C. Rosenwald. 2001. “Ever Upward and No Turning Back: Social Mobility and Identity Formation among First-Generation College Students.” In Turns in the Road: Narrative Studies of Lives in Transition, edited by Don P. McAdams, Ruthellen Josselson, and Amia Lieblich, 91-119 Washington, DC: American Psychological Association.

Rothmund, Constance A. 2008. “Correlation Between Course Interactivity and Reported Levels of Student Satisfaction in Hybrid Courses.” PhD diss., Capella University, 2008.

Sitzman, Kathleen, and Debra Woodard Leners. 2006. “Student Perceptions of Caring in Online Baccalaureate Education.” Nursing Education Perspectives 27, no. 5: 254-259.

Smale, Maura A., and Mariana Regalado. 2014. “Commuter Students Using Technology.” Educause Review Online.

Smith, Aaron. 2015. “US Smartphone Use in 2015.” Pew Research Center. Retrieved May 13th, 2017 from http://www.pewinternet.org/files/2015/03/PI_Smartphones_0401151.pdf

Tronto, Joan C. 1993. Moral Boundaries: A Political Argument for an Ethic of Care. Psychology Press.

Vignare, Karen. 2007. “Review of Literature, Blended Learning: Using ALN to Change the Classroom—Will It Work.” Blended Learning: Research Perspectives. 37-63.

About the Author

Karyna Pryiomka is a doctoral student in the Social/Personality Psychology PhD program and has earned the Interactive Technology and Pedagogy Graduate Certificate at the Graduate Center, CUNY. Drawing on the history of psychology and the philosophy of science, Karyna’s research interests include the relationship between psychological assessments and education policy, validity theory, and the qualitative/quantitative divide in social science research. Her dissertation will explore the relationships among the various forms of evidence that inform college admission decisions. Karyna brings these interests and a blend of critical and digital pedagogies into her teaching of psychology and statistical methods courses at CUNY.

Skip to toolbar