Tagged digital pedagogy

Students in youtube montage are apparent.
2

Classmates, Family, Friends, Followers, Allies, Opponents, Enemies, Bosses, Trolls, Haters, Users, and Google: Understanding Digital Audiences On YouTube

Abstract

For well over a decade now, college writing teachers have recognized a “digital imperative” to empower and guide students to compose and publish digital work. The choice to publish to the complex audiences of the internet offers remarkable opportunities, raises critical issues, and involves some real risks. Since 2013, students in Sean Molloy’s college writing classes have posted their “3-minute movie” video essays to YouTube and thought about the kinds of audiences they might reach there. (Carissa Kelly posted her video in 2016.) Some of these video essays have now reached growing audiences for eight years. By sharing these publicly posted movies with new writing classes, we have built an academic conversation about intended and unintended YouTube audiences which has extended across classrooms, semesters, and two colleges. Gradually, we have developed a YouTube audience model that we share and discuss here, including some new insights based on Carissa’s case-study analysis of YouTube’s creator studio data for her video. We offer this report of our eight-year conversation about reaching YouTube audiences as one way to transcend the constraints of the writing classroom and semester—while also critically examining Google/YouTube’s power to mediate access to these audiences.

With two billion current users, the potential YouTube audience is huge and complex. In 2010, anthropologist Michael Wesch argued YouTube videos could reach millions of viewers, build participatory networks, enact change, and empower every voice. Now a few videos even reach billions of views. But while YouTube has embraced a social media culture that values “community, openness and authenticity,” this same “participatory culture is also YouTube’s core business” (Burgess and Green 2018, vii). View counts track both rhetorical and financial success in this massive digital marketplace, as engineers quit NASA for careers creating squirrel obstacle course videos. The competition for eyes is fierce: five hundred hours of video are uploaded every minute. And viewers are often fickle; twenty percent may leave if they are not hooked in the first ten seconds. Unintended audiences are complex too. Videos can anger or alienate family, friends, followers, colleagues, and employers. Copyright claimants can intervene to edit, monetize, or delete videos. Trolls lurk everywhere. And behind the scenes, YouTube/Google manipulates everything to maximize its profit and its power.

YouTube as a Site For Studying Digital Persuasion and Audiences

About sixteen years ago, new Web 2.0 platforms began to encourage mass audiences to join in new participatory and collaborative digital dialogues. In 2004, NCTE guidelines urged writing teachers to “accommodate the explosion in technology from the world around us” (7). A growing sense of urgency developed about the growing gap between school writing and students’ lives as digital composers and publishers (Richardson 2009, 5). Kathleen Yancey issued a “call for action” to writing teachers to “join the future” (2009, 1). Liz Clark argued that writing teachers faced a “digital imperative” (2010, 27). By 2014, Kristine Blair observed a “tectonic shift from alphabetic to multimodal composing at all levels of the writing curriculum.”

Some writing teachers began to focus on video and YouTube. By 2009, Brian Jackson and Jon Wallin saw the “informal, messy process” of “back-and-forthness” on YouTube as a model for teaching digital rhetoric (375). In 2010, Michelle Barbeau saw the powerful potential for YouTube as an object of study in college writing courses that could “appeal to digital natives, increase awareness of contemporary rhetorical communities, lessen the gap between teacher and student, and spark excitement in the classroom” (2). By 2013, Sarah Arroyo recognized that online video was “becoming the prototypical experience” of the internet, cultivating a culture that was “already permeating the institutions of our daily lives,” especially on YouTube; she called for a “participatory composition” pedagogy to interrogate that culture (2). In 2018, Christina Colvin found that assigning collaborative video essays offered her students broad opportunities to study process, mediation, and argument.

Since 2013, students in Sean Molloy’s college writing classes have been posting their “3-minute movie” video essays to YouTube and thinking about the kinds of audiences they might reach there. (Carissa Kelly posted her video in 2016.) In an informal longitudinal study, Sean has tracked the monthly view counts for all those students who chose to make their videos “Public.” He also shared the publicly posted videos with new writing classes, building an extended academic conversation about YouTube audiences. Gradually, our classes developed the YouTube audience model that we share here, together with some new insights based on Carissa’s case study of her video’s audiences using her data from YouTube’s creator studio. We offer this report of our eight-year conversation about reaching YouTube audiences as one way to transcend the constraints of the writing classroom and semester—while also critically examining Google/YouTube’s power to mediate access to these audiences.

Studying YouTube Audiences at Hunter and WPU 2013–2020

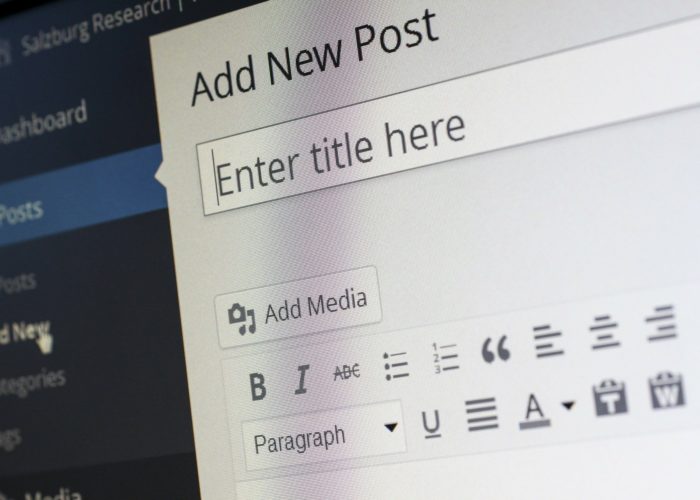
Sean began to ask first-year writing students to “reimagine” a text essay as a “3-minute-movie” in 2009. Most students submitted those movies on DVDs and the assignment focused largely on multimodal composing processes. In the Spring of 2013, Sean revived the movie assignment at Hunter College. In this “writing about writing” course model with an inquiry focus, students developed their own individual writing projects and research studies. They addressed the same thesis question for both a text-based and a video essay. Students posted all drafts to their own YouTube accounts. First and second drafts were all “Unlisted” to allow for teacher comments, peer review, and revision. Each student then chose whether to go “Public,” as well as how long to stay public after the semester. In Fall 2016, Sean brought the same writing course model and three-minute-movie assignment to William Paterson University.

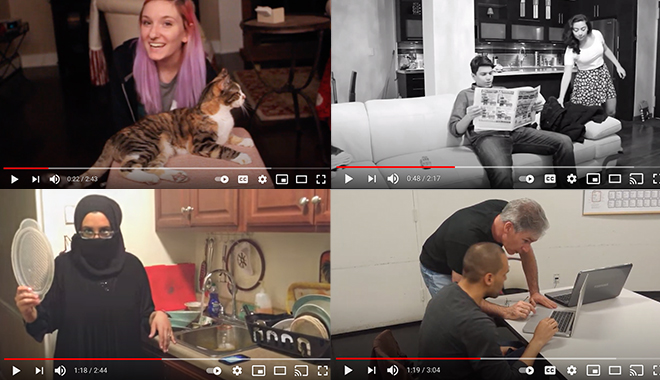
Although they worked on other essays, many students at both colleges chose to reimagine their research studies as videos. We soon saw that many videos tended to move from inquiry toward direct arguments and/or public advocacy. Isabella (2014) challenged gender stereotyping in commercials. Hannah (2019) demonstrated the harmful effects of Cosmopolitan ads on young women. Rehma (2014) mocked stereotypical portrayals of Muslim families. Tanya (2014) concluded that Sean’s writing class did not meet all of Friere’s requirements for praxis. Ashley (2017) conducted a self-study to prove veganism can be affordable. Gregory (2013) argued against gender barriers in nursing. Meredith (2019) offered college students tips for professional success.

An array of screenshots from YouTube videos of movie essays. One shows women sitting at a table with a copy of Cosmopolitan magazine, the next a picture of a male nurse in front of the statistic: 'Men in nursing, 9.6%, 333,000,' the next a black and white image of a man sitting on a couch reading a newspaper while a woman in a skirt picks up his coat; the bottom row features a mock portrayal of a student's mother wearing a niqab while washing dishes in the kitchen,  a chart labeled 'Experience' with four labeled dots underneath pointing to each other, labeled 'practice,' 'learning,' 'experience,' and 'success,' a shopping cart with produce and groceries inside, and an image of Sean standing near a seated student and they are both looking at a laptop.
Figure 1. Screenshots from student movie essays. Top row, left to right: Hannah, Gregory, and Isabella. Bottom row, left to right: Rehma, Meredith, Ashley, and Tanya.

Composing, publishing and studying video essays changed how students saw themselves, their teacher, and their work. Sean offered extra credit to students who chose to go public and also to promote their movies to substantial audiences. Publishing videos for audiences beyond our classroom raised new questions. (Do I want my brother to see this movie about our dad? Will I lose followers? What will my boss think?) The video medium and the “movie” genre often allowed, suggested, or even required students to shift away from some constraints of academic/school writing. (Can I be funny? How do I add a creative commons or public domain soundtrack? How about animation? How many words can I put on text slides if viewers watch on phones? Can I create a mock movie trailer? Should I narrate face to camera? Should I add other faces or voices? How do I get informed permission? Should I use my real name?) Peer review exercises soon demonstrated that classmates were sophisticated consumers and creators of social media and video arguments with sharp instincts for adding power.

In 2013–14, many Hunter students chose not to go public. Over the years since, others deleted their movies, or relisted them as private/unpublished. But in March of 2021, eleven were still up and public; most were still adding new viewers.[1] For example, Nicole (2014) used her rhetorical analysis of dorm room decorations to explain Kenneth Burke’s ideas about arguments of identification.

This line graph shows Nicole's movie essay views started at 0 in January 2015 and have steadily climbed to 3,500 views in July 2020.
Figure 2. Nicole’s Burke Essay’s YouTube Views chart from January 2015 to March 2021.

Her audience has consistently grown since 2014. And a clear pattern has emerged: this serious academic subject draws more new viewers during the fall and spring academic semesters and fewer during summer and winter breaks (Figure 2).

Gradually, Sean began to see how the videos shattered the constraints of both the classroom and the semester. First, they reached growing audiences around the world for months or years. Second, the lessons learned from videos carried over to later semesters as new classes reanalyzed their situations and audiences. Third, we began to spread the conversation to other teachers and students. Between 2014 and 2021, six Hunter and WPU students have presented insights about their videos to groups of students and teachers. Sean also posted his related assignment on avoiding intellectual property and copyright problems to a CUNY graduate student website in 2014. He co-published a gallery of public student movies with introductions by the student composers in 2015. He published an online package of teaching materials for his “3-Minute Movie” assignment in 2016.

Our Fall 2016 Writing Class

Carissa took Sean’s first year writing course in Fall 2016. She was a new paraprofessional at a school for children and young adults with autism and she wanted to pursue teaching. While she enjoyed her job, Carissa saw students being treated in ways that didn’t make sense. A nonspeaking student was told to stop singing in class. A boy rocking in his chair was told to have a “quiet body.” A girl scripting to soothe herself was told to have a “quiet mouth.” Why suppress these students’ natural ways of communicating or interacting with the world? The answer was the Applied Behavioral Analysis (ABA) therapy model used by the school. After doing some research on the topic and looking for the opinions of those in the Autistic community, Carissa learned that ABA was rooted in ableism, or “the discrimination of and social prejudice against people with disabilities based on the belief that typical abilities are superior” (Olson 2019). ABA therapy was developed from the 1960s through the 1980s by behavioral psychologist Ivar Lovaas who believed that “you start pretty much from scratch when you work with an autistic child. You have a person in the physical sense—they have hair, a nose and a mouth—but they are not people in the psychological sense… You have the raw materials, but you have to build the person” (Kronstein 2018).

Carissa thought Sean’s independent research project would be a good way to learn more about ABA. With her school’s permission, she conducted a rhetorical analysis of their in-house ABA procedures manual. She wrote a formal academic report, concluding that the ABA manual contributed to ableism in her school and published it to the website she created for Sean’s writing course, which she chose to make “Public.”[2]

With her classmates, Carissa watched some of the Hunter student movies and discussed the situations those students had faced. She chose to reimagine her ABA manual analysis as an advocacy piece, hoping to alert educators and parents about the potential harm from ABA therapy. Although she was passionate about the idea, she was still new to the topic and wary of sharing her criticism about such a widely accepted therapy, especially since her own workplace used it. Suddenly, the idea of “audience” was much more authentic: she risked losing her job if her bosses watched her video.

Carissa composed her video in four drafts. In the first draft, she talked through a plan on camera. In the second draft, she added a scripted narration, citing research and using technical jargon. Unable to include children due to ethical concerns, Carissa used her cats to model the therapy. In draft three, she used the cats more and moved them up to the first twenty seconds to hook viewers and lighten the overall tone. In this draft Carissa also cut the jargon way down, added citations to research studies to build credibility, and edited the running time down to 3:02. Small edits in the fourth (and final) version cut the video down to 2:43. After weighing the pros and cons, Carissa decided to go “Public,” expecting she would reach only a few dozen viewers.

Our YouTube Audience Model

As we learned more about YouTube audiences for our movies, Sean’s classes began to develop an audience chart model and revise it across semesters.[3] As the assignment developed over time, students read Laura Bolin Carroll’s (2010) “Backpacks and Briefcases,” together with the developing chart and a selection of student movies. (In the last year, Sean has assigned drafts of this article.) We quickly realized that these audiences were not separate tiers but one ecosystem—all interacting in different ways in each situation as soon as we click “Public.”

Audience Types Potential Size Examples Time Arc
Classroom 1–20 Teacher, Class Days or weeks.

[Views end with semester.]

Promoted 1 to 4000+ Family, Friends,

Social Media

Days.

[Views spike and then flatten.]

Sponsored

(Academic)

30 to 300+ Other Writing Classes

Teachers/Educators

Other college students

From time to time.

In person screenings

[Views make small jumps.]

Intended/Ideal/

Target/Organic

1 to 7000+ Effective Agents (Bitzer)

Partners/Collaborators

Affected Communities

Academic Communities

Months or Years.

[Views grow steadily.]

Suggested by Google/YouTube 1 to 6000+ Also Organic—but views are initiated by YouTube Years

[Views grow in spurts.]

By Device 1 to 7000+ Mobile, Desktop, Tablet, TV, Game Console Years.
Online Hostile 1 to 200+ Hostile Views,

Trolls and Haters

Until you delete or go “Private”

But videos can be copied.

Real Life Hostile/Unintended Not many but possible big impacts Copyright Claimants, Employers, Family, Friends,

future life partners, etc.

Until you delete or go “Private”

But videos can be copied.

Corporate One YouTube/Google Google has it forever.
Table 1. Types of YouTube audiences.

Classroom Audiences

Most college writing assignments have an audience of one teacher and maybe one or two peer-reviewer classmates. Each student video starts with that audience too, first with teacher and peer reviews of drafts, and then in a “movie night” where creators introduce and screen their final movies to the whole class.

Promoted Audiences

If students go Public, they can also choose to promote their movie and build a quick base of viewers by the semester-end, perhaps also becoming more visible to search engines. A three-minute movie is often a lot easier and more comfortable to share on Facebook or Instagram than a ten-page study or essay, even one posted to a blog or website. But self-promotion to friends, family, followers, and work colleagues can feel trickier than sharing work with two billion strangers just by marking a video “Public.”

Direct promotion can also reach members of your intended audience. Abdus (2017) designed and ran a study that administered a “push” survey to warn fifty customers in his donut shop about the harmful effects of sugary sodas and sweetened coffees. His survey was effective: forty of fifty subjects (80 percent) chose a healthier drink.

This line graph shows Abdus's movie essay views started at 0 in January 2018 and made a sharp increase to approximately 3,500 within a month. After that initial jump, the line flattens out and stays around 4,000 views up until July 2020.
Figure 3. Abdus’s Sugary Drinks Essay’s YouTube Views chart from December 2017 to March 2021.

But YouTube offered Abdus a chance to warn many more people. In a single week, Abdus used social media (with a big assist from his brother) to promote his video version of his study to over one thousand viewers. When Sean created a small winter-break promotion contest, Abdus added over 2,500 additional views. Even with 3,500 total views in its first month, this movie did not get much help from YouTube’s search and suggestion systems, and new views soon flattened out. In October 2019, another one of Sean’s writing classes decided to promote Abdus’s movie again as a team project; their promotion added another 270 views. In all, the three promotion efforts enabled Abdus to warn almost 4,000 people about harmful sugary drinks—all with almost no help from YouTube.

On the other hand, promotion may also push a movie toward unintended and/or hostile audiences. Carissa wanted to get her message out but she decided to not promote her video on social media where her coworkers might see it. It felt important to consider not just whether they saw it—but also how they found it. She did not want to appear to be pushing her criticism of a therapy they used in their faces. However, she saw less risk if they happened to come across it on their own.

Maybe Google/YouTube won’t suggest a movie with one hundred views to larger audiences. But some of our videos with a couple of hundred views have gone on to find new eyes month after month. At the same time, videos with only a handful of initial views (even excellent ones) often draw no new eyes over time. And even if a video’s audiences flatten out after a short promotional spike, reaching any real-world audience beyond the classroom is still a powerful choice that breaks free from the normal constraints of classroom writing.

Sponsored (Academic) Audiences

Every semester Sean shares old videos with new classes. This sponsorship creates a type of academic audience somewhere between promoted and organic. These students are not choosing to watch due to their needs and interests, except as a model for their own videos, a way to study audiences, and/or to get course credit. But they can be organic in some ways too. Carly’s (2016) study traced how her NJ high school failed to prepare students for writing expectations at a number of colleges. Many of Carly’s four-hundred–plus viewers have been Sean’s writing students. This past summer, Carly’s movie (with her consent) was added to WPU’s writing teacher resource website. This is, in one sense, another form of sponsorship by WPU writing teachers. But the line between sponsored and organic growth gets pretty blurry.

“Organic” Intended Audiences

When ancient Greek rhetors studied persuasion 2,400 years ago, their audiences and situations were small and simple. A persuader spoke to a single, visible “Public” or audience at one time and in one place. They could see each other and interact; they often knew each other; they had similar privileges, beliefs, and values. But as Phillip Gallagher (2019) notes, today’s digital audiences are far more complicated, “redefined by attributes of digital spaces and online communications.” Gallagher observes that as digital platforms “blur the boundaries between private and public domains,” they also splinter any single Public/audience into many different “knowledge cultures” each of which is an “organic assemblage of individuals into a group around a particular topic of interest.” Melanie Gagich (2018) also focuses on finding the ideal organic audience for any particular argument. She replaced an “imagined audience” assignment with digital composing and publication, which urged students “to address a ‘real’ community that they know from experience.”

Defining organic YouTube audiences early on (Who is this for? What work will it do?) has led students to often find multiple organic audiences. Like Gallagher’s knowledge communities, some of these audiences share a “topic of interest.” But others feel more like Gagich’s description of real communities that they know. For example, the intended audience for Sil’s (2018) anti-gang movie was complicated.

This line graph shows Silvester's movie essay views which begin at 0 in April 2018 and reach approximately 1,600 by July 2020.
Figure 4. Silvester’s Movie Essay’s YouTube Views chart from April 2018 to March 2021.

He wanted to warn young people and parents in his home town of Atlantic City, as well as families in similar communities. But he was also speaking to people who did not understand the struggles of families in towns like Atlantic City. A steady audience found Sil’s video every month for over two years. But in June 2020, as Black Lives Matter protests erupted across the nation and focused increased attention on the devastating effects of structural racism, Sil’s new views spiked up. He has again seen sharper growth in early 2021 (Figure 4).

Deanna’s (2019) conversation with her mom about converting to Judaism had, in one sense, a large potential organic audience of people considering conversion. But Deanna’s main purpose soon became to create an oral history for her own family. Nakia’s (2019) interviews about the “talks” black parents give their children to try to keep them safe also began with her family as her organic audience. But Nakia also promoted her movie to almost two hundred viewers at the end of our Fall 2019 class and its organic audience has grown slowly since, including a noticeable jump in the month after George Floyd’s murder.

The movie assignment can also draw audiences in “writing about literature” courses, at least in Sean’s horror-themed sections. But the organic audiences feel much closer to the “knowledge cultures” focused “topics of interest” proposed by Gallagher. These essays can discuss less serious issues of broad interest to large organic audiences of pop culture fans. Matt (2019) analyzes the monster in Bird Box (2019), arguing that it is H.P. Lovecraft’s Cthulhu. He did not promote his movie and its audience grew slowly for two months. But starting in September, an audience began to find it and his monthly views increased for seven months before slowly declining in early 2021— possibly as interest in the Birdbox movie waned (Figure 5).

Matt's YouTube views chart shows his views starting at 0 in May 2019 and having a slow increase up until September 2019 where it reaches about 100 views. After September they increase to about 90 views a month reaching 1,000 views by March 2020.
Figure 5. Matt’s Birdbox Essay’s YouTube Views chart from May 2019 to March 2021.

We have been surprised by how much of the organic audience growth for different movies is close to linear over months or even years. Sometimes organic audiences curve up for a few months or slowly level out. But we are also increasingly aware that explanations about audience growth based on real world factors must be understood as refracted and distorted through the sheer power that is exerted by Google itself. A closer look at Carissa’s audience growth since 2016 demonstrates this power.

Two Views of Carissa’s Organic Audience

In 2017, Sean could see Carissa find a growing organic audience. From March to September 2017, her growth rate was viral, climbing to over five hundred views a month. Then her rate of new viewers gradually declined, with a small surge in early 2021 (Figure 6). Sean could only guess as to why Carissa’s audience grew so quickly during 2017 and then slowed.

Carissa's movie views chart starts at 0 views in December 2016 and begins to make viral growth from March to September 2017. After September her views continue to grow but at a much lower rate. As of June 2020, the chart shows her video has surpassed 7,000 views.
Figure 6. Carissa’s ABA Essay’s YouTube Views chart from December 2019 to March 2021.

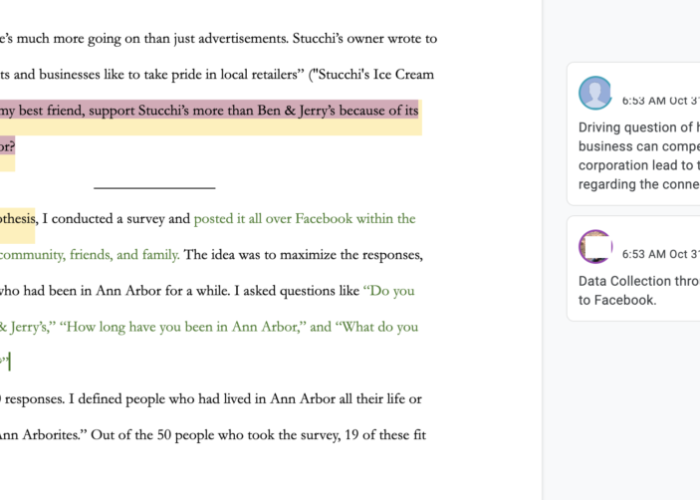
When Carissa studied the data available to her in YouTube’s creator studio through mid-2020, she was able to learn a lot more about how her organic audience found her video. YouTube breaks viewer sources into five key categories: YouTube searches, YouTube suggestions, external sources (like websites or Facebook), other YouTube features, and browse features (these last two are also suggestions and features inside YouTube.) The largest source of what YouTube calls “traffic” (3,765 of total 7,355 views) came directly from YouTube searches, most often “aba therapy.” YouTube’s suggestions to viewers of other videos generated 1,577 more views. (We discuss Suggested Audience below.) Carissa had hoped that audiences would find her video through searches. But she didn’t anticipate how much the internal YouTube searches and suggestions—as opposed to general Google searches or human referrals—would dominate audiences’ access to her movie. And it turned out that the YouTube search algorithm treated her video very differently over time.

External recommendations sometimes appeared to influence YouTube search results and suggestions. In January 2017, a Facebook advocacy group dedicated to “better ways than ABA” found and recommended her video which generated three small 2017 viewership bumps: about twenty in January, fifteen in May, and about sixty-five in August and September. (See the blue dotted line in Figure 7.)

This chart breaks down the places where the external views on Carissa's video came from: 1. Google/Google Search, 2. Facebook, and 3. Rutgers. The Facebook line has three small 2017 viewership bumps: about 20 in January, 15 in May, and about 65 in August and September. Rutgers has a bump of about 15 in June 2017. And Google/Google Searches has a peak of ten alongside Rutgers in June 2017 and another bump of about 18 views in November 2017.
Figure 7. External Traffic Sources chart for Carissa’s movie essay from December 2016 to December 2017.

Before the first bump, YouTube’s search, suggestions, and other features did not seem to offer or suggest Carissa’s movie to viewers. But right after the Facebook group voiced their support, new views from YouTube searches, YouTube suggested videos, and other YouTube features all spiked up (Figure 8).

The data in this “traffic sources” chart is taken directly from YouTube’s creator studio and breaks down the sources of where the views come from: 1. YouTube searches, 2. Suggested Videos, 3. External Sources and Direct and Unknown sources, 4. Other YouTube features, 5. Browse features, Channel pages, Playlists, Notifications, playlist pages, and the End Screen. YouTube Searches and Suggested Videos peaks to about 250 and 180 views respectively in September 2017. The chart shows the first bump in views came from YouTube Searches and External sources in January 2017.
Figure 8. Traffic Sources chart for Carissa’s movie essay from December 2016 to June 2020.

YouTube’s support added significant new viewers, peaking in September 2017. Viewers from YouTube suggestions and other features dropped off after only a few months. But new viewers from YouTube searches decreased more gradually over three years as YouTube stopped including it in search results.

Later referrals from credible human sources did not revive the algorithm’s support. A George Mason University recommendation has added about thirty views every September, January, and May, coinciding with Fall, Spring, and Summer semesters beginning in 2018. Rutgers University and Seneca College also sent viewers to Carissa’s movie. Another external recommendation came from a Slovakian forum for expectant mothers which generated thirty-four views in May of 2019. In the end, this more detailed analysis reaffirms the power of YouTube as a bridge or a gatekeeper to Carissa’s organic audience.

Audiences By Device

Although this does not measure a kind of audience community, we were surprised when Carissa studied her own YouTube data that over half of her total views over four years were on mobile devices. Computer views were only 39 percent, with 8 percent on tablets and smaller slices on TVs and game consoles (Figure 9). We’ve added this category to the audience chart to inform future composing choices.

This pie chart breaks down what device the total 7,345 viewers were using. 3720 were from mobile devices, 2862 were from desktops, 588 were from tablets, 122 were from TVs and 53 were from game consoles.
Figure 9. Carissa’s Movie Views by Device pie chart from June 2020.

Unintended/Hostile Audiences

As creators and advocates, we often focus on organic audiences—the eyes we want to reach, the minds we can persuade to act, the people who can identify with our interests and struggles. But we have learned that thinking about unintended audiences can be just as important. Every creator who borrows content must consider possible copyright claims. Students who could not resist a Lady Gaga soundtrack or Disney video clip risked having ads inserted in their videos or having the videos muted or deleted. So, we review creative commons content, public domain rules, and murky “fair use” considerations. Both going “Public” and choosing to promote videos presses many students to think carefully about how people in both their real lives and in their online lives will react.

Trolls and haters have been an unavoidable part of YouTube’s ecosystem from its birth. Some harsh and even antagonistic comments can be forms of sincere engagement. But Burgess and Green observe that it has become evident in recent years that some trolls mount coordinated campaigns of disinformation or harassment, even “weaponizing” comments to silence diverse and progressive voices (2018, 120). They argue that learning to manage trolls, “both practically and emotionally, is one of the core competencies required” for successful YouTubers (2018, 119).

This is a screenshot taken from the comment section of Carissa’s video. The first commenter, user Iassus prophetam, says: This was a very cute way to show people in a non offensive way some very offensive things they’re done by the APA. User Laura Markland replies, y’all are so ignorant and quotes Iassus’s misspelling: “Thinks that are done by the APA.” Then she says, “You guys have no idea what ABA practitioners are taught to do as I am about to complete my degree and take the board exam to be licensed. It is a scientifically proven method. User Barfo281 replies to Laura, It’s not scientifically proven, you liar. User Homo Sapiens Logicus replies, “Scientifically ‘proven’ method” … I.E. Scientists, that is social scientists, used captive institutionalized children, 60–70 years ago, to prove that with enough torture you can get some of those children to obey commands some of the time. We had to tone it down a bit, after there were no more institutions to hide what we were doing, but the technique has never really been refined and we never follow up on the ‘patients’ to find out.
Figure 10. A view of the comment section on Carissa’s ABA YouTube movie.

In theory, robust, heated, and even hostile comments may change how we think about the original videos as finite and fixed arguments by a single creator. But in practice, student creators/advocates may face abuse and trauma. The comments on Carissa’s movie started coming in early 2017. She expected opposition; in a way it marked her success. For a while, she tried to peacefully engage with skeptical and even hostile viewers, choosing to become a public advocate in a new way. But she soon became overwhelmed and took a step back. Returning months later, Carissa noticed that the comment section had taken on a life of its own as her viewers began to debate each other. To this day, the comments grow with new debates, even though Carissa has not rejoined them.

Suggestions and Our Corporate Audience: YouTube/Google

Purchased by Google in 2006, YouTube is an arm of one the world’s largest four corporations, with Amazon, Apple and Microsoft. Together These “big four” dominate internet commerce and our digital lives. In 2017, John Herrman criticized the ways in which these “all-encompassing internet platforms” assume innocent “costumes of liberal democracies,” while they are in fact “always a commercial simulation,” inducing us all to entrust increasing portions of our “private and public” lives to “advertising and data mining” firms. In this complex new reality, we two billion users are also two billion products. YouTube/Google mines our data to sell targeted ads and instant purchase buttons—earning $15 billion in 2019 (Duffy 2020).

YouTube always fills your screen with suggested videos to lure you to stay on the platform as long as possible. As Carissa’s video began to find its organic audience, YouTube began to suggest it to viewers of similar videos. Over time, what YouTube describes as “views from suggestions appearing alongside or after other videos” added 1,577 viewers, her second largest audience. We realized we had not considered this side to YouTube’s “participatory culture.” Classroom views are mostly initiated by the teacher. Promoted views are initiated by the creators, their families, friends, and followers. External recommendations come from interested communities. Google and YouTube searches are initiated by organic audiences—even if Google controls the actual search results.

But video suggestions are initiated directly by Google. Like any other form of promotion, that is partly a good thing for creators who can reach more eyes. Carissa’s video appeared alongside suggested videos that were also questioning the use of ABA, most notably the video, “Is ABA Therapy Child Abuse?” But the degree of control that YouTube exercises over its suggestions is a troubling reminder that the most important, powerful audience on YouTube is often YouTube itself.

Conclusion

Over eight years now, we have learned a few things about YouTube audiences and how we can think about them in useful ways. We are happy to share that here, maybe as a starting point for further discussion, or for similar conversations about digital audiences. We continue to learn every semester and we welcome creators in other classrooms to join us in thinking about these and similar questions. How do we balance public digital advocacy and protection from abuse? How do we assert our fair use rights in systems that give so much power to copyright claimants? How do we resist and oppose the power of Google to limit our audiences, even as we use its platform and tools? How can we build similar classroom conversations on other platforms that reach thousands of eyes?

We have not unlocked Google’s search algorithms to figure out how to turn serious college video essays into viral sensations. Google/YouTube suggests that the success of our videos is in our hands, based essentially on the quality and rhetorical sophistication of our work—even as it only vaguely describes its “search and recommendation systems [as using] hundreds of signals to determine how to rank videos.” Of course, quality and persuasive power do matter. And adding enticing titles, interesting thumbnail images, compelling video descriptions, thorough lists of tags, and other searchable metadata—all that may help too. Promotion to build an early audience has often seemed to matter for us, although a few videos (like Carissa’s) still find growing audiences with very little creator promotion.

But Carissa’s case study of her video also demonstrates that Google/YouTube’s algorithm computers are faithless friends. YouTube did not promote her video. Then it did. Then it didn’t. And those mercurial decisions held great power: at least 83 percent of her total audience through March 2021 has been due to Google/YouTube referral sources. YouTube is a rigged game, and it is the only game in town. As critical thinkers and creators, we keep that reality in mind as we call it out and resist it.

Yet, we also remain excited and hopeful. This flawed corporate platform still gives all of us a chance to reimagine the work we do in writing courses and why we do it. We can practice and study how to compete to reach audiences far beyond one teacher, one classroom, one semester, and one college. We can all publish work that may find a growing audience around the world for years to come.

Notes

[1] The WPU IRB confirmed on August 26, 2020 that this research and article did not require formal IRB review. We cite only public videos whose creators have reviewed a draft of this article and agreed in writing to be included.

[2] Carissa’s website has lived beyond the classroom and semester as well. She has reedited and updated it with new information gathered over the years.

[3] The “suggested” and “device” categories are new here, added based on Carissa’s case study. The “audience size” column uses Carissa’s and Abdus’s audiences for these estimates.

Bibliography

Arroyo, Sarah J. 2013. Participatory Composition: Video Culture, Writing, and Efficacy. Carbondale: Southern Illinois University Press.

Barbeau, Michelle. 2010. “Teaching Writing with YouTube.” Lore Journal 8: 1–10. http://www.lorejournal.org/wp-content/uploads/2014/11/Barbeau-Teaching-Writing-with-YouTube.pdf.

Blair, Kristine. 2014. “Letter from the Editor.” Computers and Composition 32 (June 2014): v–vi.
https://doi.org/10.1016/S8755-4615(14)00030-9.

Burgess, Jean and Joshua Green. 2018. YouTube: Online Video and Participatory Culture. Cambridge: Polity Press.

Burzynski, Matthew. 2019. “Is Cthulhu really the monster in Bird Box?” May 7, 2019. YouTube Video. https://youtu.be/C4jL8kQO75k.

Carcich, Hannah. 2019. “The Effects Cosmopolitan Magazine Ads Have On Women.” December 17, 2019. Video. https://youtu.be/7O_WibaDyXg.

Carroll, Laura B. 2010. “Backpacks vs. Briefcases: Steps toward Rhetorical Analysis.” In Writing Spaces: Readings On Writing, Volume One, edited by Charles Lowe and Pavel Zemliansky, 45–58. Parlour Press. https://writingspaces.org/essays/backpacks-vs-briefcases.

Clark, Elizabeth J. 2010. “The Digital Imperative: Making the Case for a 21st-Century
Pedagogy.” Computers and Composition 27, no. 1: 27–35.
https://doi.org/10.1016/j.compcom.2009.12.004.

Colvin, Christina M. 2018. “Video Essays and Virtual Animals: An Approach to Teaching
Multimodal Composition and Digital Literacy” The Journal of Interactive Technology &
Pedagogy
13. https://jitp.commons.gc.cuny.edu/video-essays-and-virtual-animals-an-approach-to-teaching-multimodal-composition-and-digital-literacy/

Divilova, Isabella. 2014. “Gender Stereotyping in Commercials.” December 9, 2014. YouTube Video. https://youtu.be/7LI6OLVOqy4.

DeVoss, Dànielle Nicole, Ellen Cushman and Jeffrey T. Grabill. 2005. “Infrastructure and
Composing: The When of New Media Writing.” College Composition and Communication 57, no. 1 (September): 14–44. https://www.jstor.org/stable/30037897.

Duffy, Clare. 2020. “How much money does YouTube make? We just learned for the first time.” CNN Business, February 3, 2020. https://www.cnn.com/2020/02/03/tech/google-youtube-earnings/index.html.

Fonsi, Luis. 2017. “Luis Fonsi – Despacito ft. Daddy Yankee.” January 12, 2017. YouTube Video. https://youtu.be/kJQP7kiw5Fk.

Fonville, Silvester. 2018. “How Does Gang Life Crush Dreams In Atlantic City?” April 3, 2018. YouTube Video. https://youtu.be/DnJ6-fkWoTs.

Gagich, Melanie. 2018. “Using Digital Rhetoric in a Multimodal Assignment to Disrupt Traditional Academic Writing: Conventions in a First-Year Writing Classroom.” The Journal of Interactive Technology & Pedagogy 13. https://jitp.commons.gc.cuny.edu/using-digital-rhetoric-in-a-multimodal-assignment-to-disrupt-traditional-academic-writing-conventions-in-a-first-year-writing-classroom/

Gallagher, Philip B. 2019. “Changing Culture, Changing Public: Redesigning the Rhetorical Public.” The Journal of Interactive Technology & Pedagogy 16.
https://jitp.commons.gc.cuny.edu/changing-culture-changing-public-redesigning-the-rhetorical-public/.

Herrington, Anne and Charles Moran. 2009. “Challenges for Writing Teachers: Evolving Technologies and Standardized Assessment.” In Teaching the New Writing: Technology, Change, and Assessment in the 21st-Century Classroom, edited by Anne Herrington, Kevin Hodgson and Charles Moran, 1–17. New York: Teachers College Press.

Herrman, John. 2017. “How Hate Groups Forced Online Platforms to Reveal Their True Nature.” The New York Times Magazine, August 21, 2017. https://www.nytimes.com/2017/08/21/magazine/how-hate-groups-forced-online-platforms-to-reveal-their-true-nature.html?_r=0.

Jackson, Brian and Jon Wallin. 2009. “Rediscovering the ‘Back-and-Forthness’ of Rhetoric in the Age of YouTube.” College Composition and Communication 61, no. 2: 374–396.

Kelly, Carissa. 2016. “The Harmful Effects of ABA Therapy.” December 12, 2016. YouTube Video. https://youtu.be/DZTNJlyvQyQ.

Kelly, Carissa. 2016. “How is ABA Harmful and Ableist?” https://carissakellywritingportfolio.weebly.com/research.html

Kittle, Peter. 2009. “Student Engagement and Multimodality.” In Teaching the New Writing: Technology, Change, and Assessment in the 21st-Century Classroom, edited by Anne Herrington, Kevin Hodgson and Charles Moran, 164–180. New York: Teachers College Press.

Krishtul, Nicole. 2014. “Kenneth Burke’s Theory of Identification: Dorm Edition.” December 6, 2014. Video. https://youtu.be/t4uCxzE3Y5s.

Kronstein, Alex. 2018. “Treating autism as a problem: The connection between Gay Conversion Therapy and ABA.” The Nova Scotia Advocate, July 11, 2018. https://nsadvocate.org/2018/07/11/treating-autism-as-a-problem-the-connection-between-gay-conversion-therapy-and-aba/

Martinez, Ashley. 2017. “How to Eat Vegan for $40 a Week.” December 8, 2017. YouTube Video. https://youtu.be/JJsg3l2R5QE

Molloy, Sean. 2016. “3 Minute Movie That Reimagines a Text Essay.” CUNY Composition Community. https://compcomm.commons.gc.cuny.edu/43-2/.

Molloy, Sean. 2014. “IP Path to Green Light.” CUNY Composition Community. https://compcomm.commons.gc.cuny.edu/ip-path-to-green-light/.

Molloy, Sean, Nicole Kristul, Naima Zahid, Isabella Divilova, Danielle St. Ramy, Judy Kang, Mario Ismailanji, Jisela Mendez, Prima Manandhar-Sasaki, Sara Panitz, and Tanya Tavaris. 2015. “A Gallery of Student Digital Compositions.” CUNY Composition Community. https://compcomm.commons.gc.cuny.edu/student-writing-and-composing/.

NCTE Executive Committee. 2004. “NCTE Beliefs about the Teaching of Writing.” Accessed September 28, 2009. http://www.ncte.org/positions/statements/writingbeliefs.

Olson, Emma. 2019. “Ableism 101: What it is, what it looks like, and what we can do to fix it.” Access Living (blog). https://www.accessliving.org/newsroom/blog/ableism-101/.

Omnicore. 2020. “YouTube by the Numbers: Stats, Demographics & Fun Facts.” Last modified February 10, 2020. https://www.omnicoreagency.com/youtube-statistics/.

Perrotta, Carly. 2016. “Is High School Preparing Students For College Writing?” December 7, 2016. YouTube Video. https://youtu.be/r6po_mS_QJw.

Richardson, Will, ed. 2009. Blogs, Wikis, Podcasts, and Other Powerful Web Tools for Classrooms. 2d ed. Thousand Oaks: Corwin Press.

Rober, Mark. 2020. “Building the Perfect Squirrel Proof Bird Feeder.” May 24, 2020. YouTube Video. https://youtu.be/hFZFjoX2cGg.

Rousseau, Gregory. 2013. “Male Nurses Movie.” December 10, 2013. YouTube Video.
https://youtu.be/6FtKQUgMeIM.

Salam, Abdus. 2017. “Sweet Drinks, Bitter Truth.” December 19, 2017. YouTube Video.
https://youtu.be/5MSFmIptZv8.

Saleem, Rehma. 2014. “Stereotypical Portrayal of a Muslim Family Final Movie.” December 16, 2014. YouTube Video. https://youtu.be/Nro0-VaZ3vs.

Schwartz, Jeffrey. 2009. “Integrating Video, Verbal and Audio Texts.” In Teaching the New Writing: Technology, Change, and Assessment in the 21st-Century Classroom, edited by Anne Herrington, Kevin Hodgson and Charles Moran, 92–123. New York: Teachers College Press.

Tavaris, Tanya. 2014. “How Does my writing class at Hunter College satisfy Freire’s idea of praxis in The Pedagogy of the O.” May 28, 2014. YouTube Video. https://youtu.be/EuwUyc9D4j4.

Theobald, Meredith. 2019. “10 Tips For Post-Graduation Success Pre-Graduation.” December 14, 2019. YouTube Video. https://youtu.be/iqGXN-njYYg.

Vassell, Nakia. 2019. “The Talk: A Black Family’s Guide to Survival.” December 18, 2019. YouTube Video. https://youtu.be/W8bSE_bzgNA.

Walker, Deanna. 2019. “What led my Mom from Catholicism to Judaism?” December 16, 2019.
Video. https://youtu.be/HsBLJVnzxpk.

Wesch, Michael. 2010. “From Knowledgeable to Knowledge-able.” Filmed August 2010 TEDxKC, Kansas City, Missouri. Video. https://youtu.be/LeaAHv4UTI8.

Yancey, Kathleen. 2009. “Writing in the 21st Century.” A Report from the National Council of Teachers of English. Accessed July 28, 2009.
https://secure.ncte.org/library/NCTEFiles/Press/Yancey_final.pdf.

Your Morning. 2020. “Former NASA engineer @Mark Rober makes incredible obstacle course for squirrels | Your Morning.” May 27, 2020. YouTube Video. https://youtu.be/8gQ84a273Wg.

YouTube Creators. 2020. “How Long Should Your Videos Be?” January 16, 2020. YouTube Video. https://youtu.be/G1tHzUGdMwY.

Acknowledgments

We thank Alexis Bennett and Hyacinth Rios, who assisted us as sensitivity readers for this article, as well as the student video creators who allowed us to share their work and their stories. This research was supported (in part) by a Summer Stipend from the Research Center for the Humanities and Social Sciences at William Paterson University.

About the Authors

A college writing teacher since 2003, Sean Molloy is an Assistant Professor of English and Director of the Writing Center at William Paterson University. His work has been published by the Journal of Basic Writing, College English, the CUNY Digital History Archive, on YouTube, and recently in two edited collections: Writing Assessment, Social Justice, and the Advancement of Opportunity (2018) and Talking Back: Senior Scholars and Their Colleagues Deliberate the Future of Writing Studies (2020).

Carissa Kelly will graduate from William Paterson University in May of 2021, majoring in Art and Secondary Education and minoring in Teaching Students with Disabilities. After college, she hopes to continue working with neurodiverse students. In her free time she enjoys making stained glass and spending time with her cat, Chippy.


Logo for CLE teaching collaborative, featuring four squares with circles that resemble students or teachers, themselves arranged facing each other in a square.
2

Collaboration, Risk, and Pedagogies of Care: Looking to a Postpandemic Future

Abstract

Teaching through the COVID-19 pandemic has been a catalyst for many important, and often long overdue conversations in education and, hopefully, longstanding changes in how we design classrooms for meaningful, connected, and innovative learning. In May 2020, Dr. Molly Buckley-Marudas and Dr. Shelley Rose, Associate Professors at Cleveland State University, founded the Cleveland Teaching Collaborative (CTC). This interdisciplinary group of instructors and instructional support professionals from Pre-Kindergarten to Higher Education emerged as a critical rehearsal space for the future. Through case studies of teaching, monthly discussions, and curation of resources, members of Cleveland Teaching Collaborative have developed a collection of pandemic pedagogies that serve as a rehearsal for the future. This article articulates three main areas of pandemic pedagogy and our vision for critical changes in education: cross-collaboration that honors distributed expertise, prioritization of people that enacts pedagogies of care, and risk-taking that sets the stage for the #postpandemicteacher.

Introduction

With the outbreak of the COVID-19 pandemic in spring of 2020, higher education and PK–12 schools abruptly transitioned to remote teaching and learning. In a matter of days, teachers at all levels of education were required to move face-to-face classes to remote, web-based contexts. Although instructors drew on their knowledge of the expansive existing body of research on remote teaching and learning, as well as a diverse range of educational resources, the spring 2020 transition to a remote context occurred without the benefit of additional time, training, or reflection. Without a blueprint for teaching and learning in a pandemic, teachers at all levels and in different institutional contexts hustled to find new and innovative ways to provide accessible, high-quality learning opportunities for all students. Like the Cleveland Teaching Collaborative (CTC) educators, all teachers imagined and enacted a still-evolving collection of pandemic pedagogies. Charged with tending to the pressing needs of their students, their communities, and their own families, our work with the Cleveland Teaching Collaborative has revealed that educators at all levels cultivated pedagogies of care and a culture of risk taking in their classrooms. The realities of the pandemic, from illness, death, and social isolation to increased unemployment, housing instability, and food insecurity, suggest that educators are teaching in an emergency.

We approach our work with the belief that what educators are learning during the COVID-19 era is useful for teaching and learning in this immediate moment, yet we also believe that what we learn during this crisis is critical to the future of education. In keeping with the call for this special issue, we consider: “How do we use what we’ve learned from teaching in and through an ‘emergency’ as a rehearsal for the future?” This network, the Cleveland Teaching Collaborative, was designed to bring together PK–university educators in Northeast Ohio to reflect on, write about, and discuss their individual experiences in these times. This work has implications for how educators and school administrators could create more connected, innovative, and humanizing spaces of learning in the future by normalizing pedagogies of care and supporting instructors to implement new strategies to enhance learning for all students.

Pandemic Pedagogies

In the face of the COVID-19 pandemic, we are living in a state of uncertainty and, according to Sharon Ravitch, “an indefinite state of flux.”  In this moment of uncertainty, both relational and educational, Ravitch calls for “flux pedagogy” (Ravitch 2020). Flux pedagogy answers the urgent need for a flexible and humanizing approach to education. Flux pedagogy integrates critical relational frameworks into a complex adaptive pedagogical approach that identifies and addresses lived problems as a form of radical action.” We have also seen increased attention to and extension of prepandemic scholarship on critical pedagogy and humanizing pedagogy frameworks. Both traditions center students’ lives and histories and emphasize the significance of social and cultural contexts. Likewise, scholars and practitioners have emphasized the need for culturally sustaining pedagogies (Paris 2012; Paris and Alim 2020), culturally responsive pedagogies (Ladson-Billings 1995), and trauma-informed pedagogies, all of which aim to honor and be responsive to students’ lived realities. Critical educational technology scholars (Mehta and Aguilera 2020; Shelton, Aguilera, Gleason, and Mehta 2020, 125–129) have conceptualized a “critical humanizing pedagogies” framework to center pedagogies of care and decenter educational technology. Pandemic era teaching has raised attention around pedagogies of care (Rolon-Dow 2005) that tend to the examination of power, social location and access to any other resources in a relational context and recognize that learning happens in the context of relationships.

We have also seen a call for educators to cultivate what Michael Nakkula and Andy Danilchick refer to as an “uncertainty mindset” (2020, 14–33). According to their guide, “Planning for Uncertainty: An Educator’s guide to Navigating the COVID-19 Era” an uncertainty mindset is, “a stance that encourages embracing the unknown in order to remain responsive to the needs and opportunities as they emerge” (Nakkula and Danilchick 2020, 7). The growing body of pandemic pedagogies is both necessary and helpful to educators as they work to navigate this time. With the belief that the pandemic as we currently know it will end, we wonder: what are the characteristics of a postpandemic pedagogy? What are the key attributes of what we refer to as the #postpandemicteacher? Some of the answers are found in the pandemic experiences of the CTC. Specifically, cultivating pedagogies of care and normalizing the risks we take when instructors center students and implement new strategies for remote, hybrid, and in-person learning.

The Cleveland Teaching Collaborative

With inspiration from NYU Shanghai’s Digital Teaching Toolkit (2020) and the understanding that the summer of 2020 would be a critical time for educators to reflect on, evaluate, and develop remote learning opportunities and pandemic pedagogies, we (Buckley-Marudas and Rose) launched the Cleveland Teaching Collaborative. We collected and published a diverse collection of educator-authored case studies of remote teaching and learning during the pandemic. A core aim was to provide meaningful and timely support and tools for critical, accessible, and high-quality learning opportunities for students living and learning in a highly imperfect time. We hoped that the project would provide educators at all levels, within and across different institutional contexts, the space and time necessary to reflect as a community and to make recommendations and suggestions for future teaching and learning. More than static case-studies, however, the CTC also had the goal of fostering ongoing partnerships between university and PK–12 educators.

The first cohort of authors in summer 2020 included twenty-three educators, twenty-two from the greater Cleveland area and one from Los Angeles, CA. The California-based educator came to the collaborative as a result of an existing professional relationship with a Cleveland-based educator. The content and emergence of their co-authored piece reflects the potential of cross-country collaborations and partnerships for teaching and learning. The summer 2020 cohort included a combination of elementary, secondary, and university instructors and reflected a wide range of disciplines. The cohort also included educators who teach in a mix of public, private, and parochial institutions and from urban, suburban, and rural contexts. Every educator authored a case study about their transition to pandemic era teaching and learning, focusing on the pedagogical approaches, tools, and principles they used to make their decisions, the challenges they experienced, and what lessons they learned for the future. All the case studies were reviewed by the CTC leadership team and then published to CTC’s WordPress site. The platform was chosen because it is user-friendly and able to accommodate multiple contributing authors.

A unique component of this collaborative is the living, growing “resource referatory.” The referatory is a curated collection of educational resources. It is a crowdsourced, open access collection that began with materials cited by CTC contributors. By the end of fall 2020, the referatory had grown to over two hundred entries and at the time of writing, the referatory has increased to over eight hundred entries. With the third cohort of authors preparing to submit their case studies by the end of May 2021, we know this number will continue to grow. In addition to the written case studies and growing referatory, another component of the CTC is the opportunity for contributors to participate in video-based discussion groups. We held three discussion groups during the summer of 2020 and, on request, have continued to host discussions at least once a month. In addition to the shared home of the WordPress site, we have a space in Microsoft Teams for questions, announcements, idea exchange, and shared files, and in November 2020 launched the Assignment Design Café for instructors as an informal drop-in space staffed by CTC members and campus partners via Zoom for instructors to support learning along the way.

Rehearsal for the #Postpandemicteacher

In the spirit of the call for this issue, we believe that what we learn when teaching in an emergency is critical to navigating and surviving the emergency, yet these learnings are also a rehearsal for the future. Drawing on our work with the Cleveland Teaching Collaborative, we share the ways in which we have observed how the COVID-19 pandemic has limited some of the possibilities for educator growth and reflection, and how teaching in the COVID-19 pandemic has created space for educators’ individual and collective reflection, revision, and re-imagination. In the sections that follow, we will focus on the key lessons and insights that should be leveraged for future educational work and what we refer to as the #postpandemicteacher.

Crisis scenarios tend to surface existing problems or inequities and serve as a catalyst for critical changes. Teaching through this crisis has been a catalyst for many important conversations in education and, hopefully, several longstanding changes in how we design classrooms for meaningful, connected, and innovative learning. The collective space of the CTC emerged as a critical rehearsal space for the future. By this we mean that the collective, in concept and action, became a catalyst for new ways of operating, interacting, writing, and imagining regarding what learning might look like. The collaborative was conceptualized as a space that aimed to cultivate new patterns and forms of interaction and participation and a space for expanding, not narrowing, the possibilities of when and why we interact with other educators. In the remainder of this article, we will share three specific ways that teaching in an emergency has contributed to a collection of pandemic pedagogies that serve as a rehearsal for the future and setting the stage for the #postpandemicteacher. The three ideas we offer are cross-collaboration, prioritization of people, and risk-taking.

Cross-collaboration: honor distributed expertise

One of the goals of the collaborative was to create spaces for educators to come together to connect, share, reflect, and enhance their teaching practice. Given the required social distancing and physical isolation that are part of the COVID-19 pandemic, we saw a need for teachers to be together and try to learn together, particularly during such an intense and demanding time. The conditions of this emergency precipitated the shift to online spaces and video calls. With this, some of the constraints tied to physical barriers, such as geographical location, buildings, and walls as well as social barriers, such as departments, roles, and affiliations were lifted. Consistent with the title of CTC members Charles Ellenbogen and Jason White’s case study, education has gained “moving walls.” For Ellenbogen and White, this meant a sustained cross-country collaboration around writing, with Ellenbogen in Cleveland and White in Los Angeles. Yet, the concept of the moving walls is similarly powerful for breaking down other walls or borders that have become deeply ingrained in the ways in which schools are organized and how ideas and information are exchanged. With the ease and accessibility of video calls, this moment could help to chip away at the existing walls dividing PK–12 educators and university educators, divisions such as discipline, department, or college affiliation within an institution, and borders we have created between different institutional roles or functions. Learning design specialist Lee Skallerup Bessette argues in her recent scholarship, the divides between instructors and instructional support staff at our institutions are both tacit, such as staff not receiving invitations to events like commencement, and explicit, like title policing (Bessette 2020; 2021; Perry 2020). The collaborative allowed university and PK–12 teachers ongoing opportunities to exchange ideas across disciplines and rank. For example, two CTC collaborators, one a part-time university instructor and one a high school teacher developed the idea for non-evaluative peer visitations.

At the institutional level, we have seen more instances of cross-functional collaboration. For example, for the first time in either of our experience at our university, we attended a meeting that included participation from tenure track faculty, part-time faculty, the instructional design center, the library, e-learning office, Blackboard support office, and our university’s center for faculty excellence in teaching. The meeting centered around a new outgrowth of the CTC called the “Assignment Design Café.” The café is structured as a drop-in opportunity for instructors, yet our staff facilitators also appreciate the space, which recognizes that regardless of position “it takes a village” to support digital teaching and learning (Bessette 2020). The café takes place on Zoom and is framed as an opportunity for participants to drop-in with an assignment, a challenge, or an idea related to their remote or web-based teaching. Although not required, all the centers and offices expressed an interest in supporting and facilitating the café. At a December session, it was powerful to listen to the range of perspectives in response to one instructor’s question about Google Forms and Microsoft Forms. Distributed expertise exists in a community in which levels of expertise vary and there is a willingness to both share and learn from that existing expertise. We benefited from the distributed expertise in the room and that many people knew different things about the platforms. Instead of one “expert” we had many knowledgeable and skilled users. In our March meeting we shared perspectives on different virtual conference platforms and started to name items that all fit on what we refer to as our “Awareness List.”  This list includes oversights, habits, and structural barriers that we, individually and collectively, have come to learn in the process of doing this work. For example, who is notified or and included in professional development opportunities and how information is distributed. This has emphasized the need to strengthen relationships between existing programs, centers, and IT personnel. The centers and supports are established on our campuses, yet they are not necessarily as integrated as possible with departments or instructors.

Instead of seeing Zoom meetings like this as an opportunity and privilege of the pandemic moment, we see this as an important lesson for the future. We know that teaching and learning improves when we can access and draw on a range and variation of diverse perspectives. When school buildings re-open, educators need to challenge and interrupt the instinct to return to the taken-for-granted ways of operating. We have seen the need to reimagine some of the systems and structures that consistently divide, rank, and sort, and, in the process, limit the benefits of cross-collaboration and distributed knowledge generation and distributions. We have used this chance as an opportunity to collaborate and work with individuals that we do not consistently see or come together with on a regular basis, yet the cross-collaborations create new opportunities for growth. How do we continue to create opportunities for educators to cross the boundaries constructed around variables including discipline, grade level, department, and teaching rank? How do we continue the practice of moving walls beyond the circumstances created by the pandemic?

Prioritization of people: enacting pedagogies of care

Pandemic teaching has reminded all of us—educators, students, parents, school leaders—that teaching and learning are deeply relational processes. One of the most critical lessons to carry forward from teaching in this global health crisis is a renewed commitment to understanding and enacting education as a human endeavor. The quality and depth of relationships with students has surfaced as an essential element of teaching in the pandemic, yet it is evident that the relational work of teaching and learning is something that must be prioritized in a postpandemic era. A theme that surfaced in nearly every CTC case study and discussion group was the pressing need to focus on relationships with students. Educators at all levels and across disciplines and institutional contexts emphasized the need to center on the students and to meet students where they were. Relatedly, many educators spoke about listening to, and regularly soliciting feedback from students outside of institutional evaluations as an important element of their pandemic teaching. Although this finding will sound familiar and may seem obvious, it became clear that these practices may not have been prioritized as much as we hoped in our prepandemic pedagogies.

Every CTC case study offered specific instructional approaches that drew on a pedagogy of care. For example, most CTC authors shared that they developed and distributed a student survey to guide their instructional approaches. According to Sophia Higginbottom, tenth-grade Language and Literature teacher and CTC author, “The first necessity was to ask students to complete a survey, which was posted into their Google Classrooms and sent via email to everyone enrolled in the course.” In Higginbottom’s essay, “Simultaneously Stimulating Autonomy and Global Citizenship: A Case Study on Education Through the COVID-19 Pandemic,” she explains that her survey focused on three areas: student access to internet and digital tools, availability for live class sessions, and students’ reflections on how they could “best learn in this new distance-learning world.”  Similarly, Lana Mobydeen, a university-based part-time instructor of political science, writes in her case study: “Once I decided to use Blackboard Collaborate, I sent a twelve-question survey via Microsoft Forms to my students regarding their internet access, preference for live or pre-recorded lectures, availability, and opinion on discussion boards. I received responses from twenty-three out of the twenty-nine students enrolled with examples of some of the responses included.”

Importantly, Mobydeen explains how she used the information from students’ responses to guide her pedagogical decisions. For example, based on preferences for live or recorded lectures, Mobydeen writes: “I decided to do live sessions and record them for students that wished to view them later. This would allow the best of both worlds for students. Whoever wanted live instruction could join via Blackboard Collaborate during our normal course time and those who could not join could view the recordings at their own pace. I did not require attendance for live sessions. I made them optional because of the impact that the pandemic had on students who might have been sick, caring for others, working, or had other issues.” This illustrates how this outreach offers an opportunity to connect with students and understand where they are. Mobydeen can then be responsive to the collected information. Mobydeen draws on a pedagogy of care in her decision-making in that she offers multiple ways to access the material and succeed in the class. John Dutton, high school science and computer science teacher, offers additional support for the value of student feedback. In “From the Tech Teacher Perspective: Distance Learning for Science, Computer Science and Fellow Educators,” Dutton writes: “Ultimately, using student feedback to consistently tailor the student experience led to improved student attitudes towards online learning.” Teachers know that student-responsive curricula improve engagement, and given that the body of evidence for effective all-school distance learning is slim, then it is critical that teachers seek student feedback on a regular basis. The parameters of this health crisis are changing daily; we must be flexible and proactive enough to seek out and respond to these rapidly evolving challenges.” The challenges of the pandemic, including the magnitude of uncertainty and unease, prompted many educators to embrace more flexibility and more care in their pedagogical approach.

Although the surveys ranged in format and frequency, the CTC authors spoke positively about what they gained from this decision. As illustrated in the examples above, authors highlighted the value of the student surveys for connecting with students in relationship to their well-being and for gaining insight into their students’ experiences in the class. Although this was not a new practice for everyone, this level and frequency of personalized, class-specific survey was new for many.

Many of the challenges that surfaced are not necessarily new, and we know that they will not go away when the pandemic ends, yet they became more challenging, more problematic, and/or more exposed during this era. For example, regarding technology, many PK–12 schools and districts were operating without a shared learning management system, making simple communication efforts and the transition to remote teaching incredibly difficult and time consuming. The moment of crisis forced us to confront what we knew, yet overlooked, about access to technology and the digital divide. At the beginning of the pandemic, many students, at all levels, lacked access to appropriate hardware for learning and reliable internet. Districts and our university scrambled to distribute laptops and hot spots to students.

In addition to individual educators adopting a humanizing pedagogy, we also noticed decisions at the institutional level that reflected a pedagogy of care. For example, offering students at the university a choice between a letter grade or pass/fail, recommendations to be flexible on deadlines, and a willingness to offer students an incomplete with additional time to complete the course. Instead of seeing these options as “easy” or “soft,” pandemic pedagogies recognize these modifications as responsive, attentive, and humanizing. They reflect an ethos of care and flexibility. Care and flexibility are imperative for teaching in a pandemic, yet these characteristics will enhance nearly any teaching and learning moment such as increasing attention to practices like ungrading (Blum 2021).

In the case of students with documented special needs, teaching in this crisis amplified the lack of existing flexibility, resources, and innovation to prioritize and support some of our state’s most vulnerable students. As Allison Welch, high school Intervention Specialist and Spanish teacher, shared in her case study, the specialized services and support for students with special needs came to a standstill and the state had no legal obligation to provide for many of the young people’s needs, exposing gaps and inequities in our current capacity to support young people in the face of disruption or extenuating circumstances. One lesson to carry forward is the recognition that many of the prepandemic teaching and learning approaches and systems were too rigid. The existing models for supporting students with special needs are not adequate for the pandemic era or, looking forward, the postpandemic era. This case highlights how existing teaching practices, along with district efforts to rely on old strategies failed students, families, and teachers. These failures exposed systemic barriers and institutional inflexibility, forcing changes in practice and increased risk taking to amend the issues.

Risk taking: setting the stage for the #postpandemicteacher

The COVID-19 pandemic has affected all instructors, regardless of discipline, expertise, and experience-level. As Ravitch argues, educators transitioned courses from “specialized teaching and learning to more broadly solutionary and connective” practices (2020). All educators have content expertise, but the pandemic serves as a stark reminder of the fact that we are all experts in learning. It is as learners that educators have excelled in this moment of flux pedagogy, and it is as learners that instructors have taken risks in their pedagogies that would have seemed unimaginable prior to March 2020.

In many classrooms, remote or otherwise, a key aspect of pandemic teaching and learning is that instructors and students find themselves in an environment where the boundaries between teaching and learning blur. This is where Davidson’s call for instructors to be “human first, professor second” is an invitation to take a risk (2020). The risk is to position yourself as part of the community of learners in your course, be transparent, and share your experiences of success and failure. Instructors may not be able to understand the specific experiences of students, but we can acknowledge pandemic learning is a new environment for us as well as students. Everyone is learning something during the pandemic, from new technologies to time management, to caring for family members while teaching and learning. Systems administrator Angela Andrews articulates how instructors and instructional support staff are already equipped to teach new concepts without the traditional mantle of expertise: “We’re always explaining things to other people. This is just an extension of it.” Andrews elaborates, “It is taking a topic that we know something about. We may not be masters in it, but at least we can speak the language, and we feel comfortable enough trying to explain it” (Andrews 2018, 00:08:41). This language of pandemic teaching includes words like equity, flexibility, and experiment.

In fact, this language is a product of digital pedagogy communities of practice which have expanded exponentially during the COVID-19 crisis. Educators who were not in the habit of thinking deeply about remote or hybrid teaching found themselves thrust into a situation where they had to grapple with new practices, often those they had been exposed to in professional development sessions prior to the pandemic but never implemented, to continue as effective educators. “Diary of a Quarantined Teacher: A Seasoned Spanish Teacher Confronts a Whole New Way of Teaching” by world language teacher Sarah Schwab, and “Converse to Learn: Online Discussions to Engage Students in Remote Learning” by sociologist Marnie S. Rodriguez, both members of the CTC, reveal the commonalities in experiences between PK–12 and higher education instructors. Everyone is involved in learning. Educators are learning new communication and facilitation technologies in order to create equitable, accessible, and meaningful classroom experiences. Students are learning new modes of communication (often across several platforms) and new content related to their course and chosen academic path.

One important aspect of pandemic teaching and learning is the recognition that the world is in flux, not just for students, but for educators as well. The CTC is just one example of how the pandemic has expanded the communities of practice of educators engaged with digital pedagogy. Indeed, many educators are engaging in new practices with students that seemed untenable prior to COVID-19. As historian J. Mark Souther reflected, pandemic remote learning has the potential to be “A Bridge to Better Teaching.” Curriculum ideas and innovation that instructors have put off due to lack of development time or technology resources in past semesters now seem possible in part due to the need for alternative delivery methods and institutional investments in licenses for key applications.

The pandemic has enabled educators from diverse backgrounds, disciplines, and levels to practice taking risks in our classrooms. As instructors begin to acknowledge classrooms as filled with communities of learners and not hierarchies of expertise the future is rife with opportunity. COVID-19 has added urgency to our academic courage, yet it has also normalized trusting oneself and one’s students enough to take regular risks. Not every new idea or assignment works. In fact, this journal has an excellent section on teaching fails that began normalizing risks and their range of outcomes even before the current crisis. Now is the time for all educators to look to the future and reflect on this experience.

Thoughts Moving Forward

As the COVID-19 virus surges, teachers will continue to navigate an uncertain present and uncertain future. There is little doubt that teachers will continue to imagine innovative and humanizing ways to teach in this prolonged state of uncertainty and that the repertoire of pandemic pedagogies will keep evolving. Although it is impossible to imagine exactly what teaching and learning will look like in a postpandemic era, we believe that the success of the future requires that we pay attention to the lessons and questions in the three areas of cross-collaboration, pedagogies of care, and risk taking. From insight on promising pedagogical practices to the radical exposure of deep educational inequities, postpandemic classrooms and schools must look different than pre-pandemic classrooms. Although we may miss many aspects of school before the COVID-19 outbreak, this crisis has reminded us that pre-pandemic school was not adequate or meaningful for far too many students. It spurred instructors and staff to work through issues previously seen as too embedded in our institutions to question. Teaching through this unprecedented and unsettling time offers educators a unique opportunity to challenge some of the time-honored approaches to teaching and learning and the taken-for-granted ways of engaging students in traditional classrooms.

For us, teaching in this emergency was a catalyst to create the Cleveland Teaching Collaborative. Although we imagined that the collaborative would be a place to support the exchange and expansion of ideas, it was impossible to know exactly how the network would unfold. With the benefit of time and reflection, we now see that one of the most critical lessons to carry forward is the role and power of the collective. More specifically, the CTC opened an important space for what we have come to refer to as collective care. The collaborative prompted dialogue between and among a range of educators, instructors, instructional designers, technologists, and administrators, most of whom do not typically interact or spend professional time with one another. This created the potential for a new space and, we observed, a new version of distributed expertise and shared knowledge generation and dissemination, all with an ethos of care. In this unprecedented moment, the silos started to break down and conversations began.

For us, collective care is an emergent concept that refracts care in three ways: (1) caring for one another (e.g., as professionals, educators, humans) by being engaged in the writing, talking, thinking of this group, (2) a group that supports and works to develop pedagogies of care, and (3) a group that believes educators and educational institutions are better off when we do this work together.  While the institutional barriers between instructors, staff, and administrators remain, and will remain, after the pandemic, the conversations will continue. They are a critical step to reimagining teaching and learning in a postpandemic classroom.

As vaccines arrive and we look toward a transition from emergency pandemic teaching and learning to a new phase of education, we are reflecting on the origins of the collaborative, analyzing what we have learned from the most recent cohort of collaborators, and planning for the future of the CTC and the #postpandemicteacher. In May 2020 we received institutional support to launch and facilitate the first cohort of authors. We used these funds to purchase three years of web hosting services and pay authors an honorarium to reflect on their experiences with remote teaching and learning. Buckley-Marudas drew on existing professional networks, including her work with the Cleveland Metropolitan School District, to recruit PK–12 educators. Both of us also reached out through personalized emails to invite reflections from a range of PK–12 and university collaborators. We chose to develop the blog on WordPress based on Rose’s previous experience with the platform and its ability to handle multiple authors. Designed as a collaborative, it was important that the host site could support all participants as named authors. As we began documenting open-access and crowdsourced educational resources for our members on a blog page, it quickly became clear that we needed a more robust solution to enable educators to search our links. Rose drew on her experience leading a digital humanities referatory project in her courses to build a resource referatory for our growing collection and train team members in curation of these items. Institutional support for the CTC was renewed at the start of the fall semester and we now have an institutional commitment to support new and existing CTC activities through the end of 2021. Recognizing that the collaborative was evolving from a support network for pandemic teaching to a network of dynamic educators committed to change beyond the scope of COVID-19, we applied for multiyear external funding to gather data from educators at this critical crossroads, make technical upgrades to our resource referatory, and use pandemic experiences to promote changes in education for Cleveland-area students and beyond.

We recognize that we do not yet know the implications of this prolonged time of social distancing and stay-at-home orders for students’ learning or for students’ and teachers’ social and emotional health and well-being. Yet, we close here with a few thoughts on what we think a post pandemic pedagogy and #postpandemicteacher might look like. The postpandemic teacher will be more comfortable taking risks and assuming the role of learner, see collaboration as a privilege and an opportunity for growth, and operate with the belief that teaching and learning are deeply relational processes that must be rooted in collective care. Focusing on these areas, the Cleveland Teaching Collaborative has not just become a space for reflection and support, but also a catalyst for change.

Bibliography

Andrews, Angela. 2018. “How to Teach When You’re Not an Expert.” Interviewed by Saron Yitbarek. CODENewbie, Season 4, Episode 7, June 4, 2018. Audio, 38.27. https://www.codenewbie.org/podcast/how-to-teach-when-youre-not-an-expert

Bessette, Lee Skallerup. 2020. “It Takes a Village: The Importance of Staff for Digital Learning.” The National Teaching and Learning Forum 29, no. 5. https://doi.org/10.1002/ntlf.30247

———. 2021. “Stop Ignoring Microaggressions Against Your Staff.” The Chronicle of Higher Education, March 8, 2021. https://www.chronicle.com/article/stop-ignoring-microaggressions-against-your-staff.

Blum, Susan D. 2021. “A Year of Pandemic Teaching: The Good List (Part I).” Susan D. Blum (blog). Accessed March 12, 2021. http://www.susanblum.com/blog/a-year-of-pandemic-teaching-the-good-list-part-1.

Davidson, Cathy. 2020. “The Single Most Essential Requirement in Designing a Fall Online Course.” Hastac. Accessed December 8, 2020. https://www.hastac.org/blogs/cathy-davidson/2020/05/11/single-most-essential-requirement-designing-fall-online-course.

Ladson-Billings, Gloria. 1995. “Toward a Theory of Culturally Relevant Pedagogy.” American Educational Research Journal 32: 465–491. https://doi.org/10.3102/00028312032003465.

Mehta, Rohit and Earl Aguilera. 2020. “A Critical Approach to Humanizing Pedagogies in Online Teaching and Learning.” The International Journal of Information and Learning Technology 37, no. 3: 109–120. https://doi.org/10.1108/IJILT-10-2019-0099.

Nakkula, Michael and Andy Danilchick. 2020. Planning for Uncertainty: An Educator’s Guide to Navigating the COVID-19 Era. Penn GSE. University of Pennsylvania. Accessed December 8, 2020. https://www.gse.upenn.edu/system/files/Planning-for-Uncertainty-Guide.pdf.

Perry, David. 2020. “Title Policing and Other Ways Professors Bully the Academic Staff.” The Chronicle of Higher Education. Accessed March 12, 2021. https://www.chronicle.com/article/title-policing-and-other-ways-professors-bully-the-academic-staff/.

Ravitch, Sharon. 2020. “FLUX Pedagogy: Transforming Teaching and Learning during Coronavirus.” Methodspace. Accessed December 8, 2020. https://www.methodspace.com/flux-pedagogy-transforming-teaching-learning-during-coronavirus/.

Research and Instructional Technology Services, NYU Shanghai Library. 2020. Digital Teaching Toolkit. Accessed March 12, 2021. https://wp.nyu.edu/shanghai-online_teaching/.

Rolón-Dow, Rosalie. 2005. “Critical Care: A Color(full) Analysis of Care Narratives in the Schooling Experiences of Puerto Rican Girls.” American Educational Research Journal 42, no. 1: 77–111. https://doi.org/10.3102/00028312042001077.

Shelton, Catharyn, Earl Aguilera, Benjamin Gleason, and Rohit Mehta. 2020. “Resisting dehumanizing assessments: Enacting critical humanizing pedagogies in online teacher education.” In Teaching, Technology, and Teacher Education During the COVID-19 Pandemic: Stories from the Field, edited by Richard E. Ferdig, Emily Baumgartner, Richard Hartshorne, Regina Kaplan-Rakowski, and Chrystalla Mouza, 125–129. Association for the Advancement of Computing in Education (AACE). https://www.learntechlib.org/p/216903/.

About the Authors

Mary Frances (Molly) Buckley-Marudas is Associate Professor of Adolescent and Young Adult English Education at Cleveland State University. Buckley-Marudas teaches courses in English Education, content area literacy, and Young Adult literature and is professor-in-residence at Campus International High School. Buckley-Marudas’s research focuses on adolescent literacies, youth-led research, and teacher education. She is currently PI on a LRNG Innovator Challenge grant and Co-PI on a multi-year IES grant, both of which focus on youth participatory action research. She has published articles in Contemporary Issues in Technology and Teacher Education (CITE), Journal of Adolescent & Adult Literacy, and is a founder of the Cleveland Teaching Collaborative and recipient of the 2022 Divergent Award for Excellence in Implementation of Literacy in a Digital Age with Shelley E. Rose.

Shelley E. Rose is Associate Professor of History and Director of Social Studies at Cleveland State University. Rose teaches a range of topics from geography to world history, gender studies to European history. Her research and professional activities focus on the topics of digital humanities, protest history, European history, and gender history. She has published articles in Peace & Change and The Journal of Urban History, leads the Gender Studies Resources database project, and is a founder of the Cleveland Teaching Collaborative and recipient of the 2022 Divergent Award for Excellence in Implementation of Literacy in a Digital Age with Molly Buckley-Marudas.

A spiral of books on library shelves appears almost as though a pie chart.
5

Supporting Data Visualization Services in Academic Libraries

Abstract

Data visualization in libraries is not a part of traditional forms of research support, but is an emerging area that is increasingly important in the growing prominence of data in, and as a form of, scholarship. In an era of misinformation, visual and data literacy are necessary skills for the responsible consumption and production of data visualizations and the communication of research results. This article summarizes the findings of Visualizing the Future, which is an IMLS National Forum Grant (RE-73-18-0059-18) to develop a literacy-based instructional and research agenda for library and information professionals with the aim to create a community of praxis focused on data visualization. The grant aims to create a diverse community that will advance data visualization instruction and use beyond hands-on, technology-based tutorials toward a nuanced, critical understanding of visualization as a research product and form of expression. This article will review the need for data visualization support in libraries, review environmental scans on data visualization in libraries, emphasize the need for a focus on the people involved in data visualization in libraries, discuss the components necessary to set up these services, and conclude with the literacies associated with supporting data visualization.

Introduction

Now, more than ever, accurately assessing information is crucially important to discourse, both public and academic. Universities play an important role in teaching students how to understand and generate information. But at many institutions, learning how to effectively communicate findings from the research process is considered idiosyncratic for each field or the express domain of a particular department (e.g. applied mathematics or journalism). Data visualization is the use of spatial elements and graphical properties to display and analyze information, and this practice may follow disciplinary customs. However, there are many commonalities in how we visualize information and data, and the academic library, at the heart of the university, can play a significant role in teaching these skills. In the following article, we suggest a number of challenges in teaching complex technological and methodological skills like visualization and outline a rationale for, and a strategy to, implement these types of services in academic libraries. However, the same argument can be made for any academic support unit, whether college, library, or independently based.

Why Do We Need Data Visualization Support in Libraries?

In many ways the argument for developing data visualization services in libraries mirrors the discussion surrounding the inclusion and extension of digital scholarship support services throughout universities. In academic settings, libraries serve as a natural hub for services that can be used by many departments and fields. Often, data visualization (like GIS or text-mining) expertise is tucked away in a particular academic department making it difficult for students and researchers from different fields to access it.

As libraries already play a key role in advocacy for information literacy and ethics, they may also serve as unaffiliated, central places to gain basic competencies in associated information and data skills. Training patrons how to accurately analyze, assess, and create data visualizations is a natural enhancement to this role. Building competencies in these areas will aid patrons in their own understanding and use of complex visualizations. It may also help to create a robust learning community and knowledge base around this form of visual communication.

In an age of “fake news” and “post-truth politics,” visual literacy, data literacy, and data visualization have become exceedingly important. Without knowing the ways that data can be manipulated, patrons are not as capable of assessing the utility of the information being displayed or making informed decisions about the visual story being told. Presently, many academic libraries are investing resources in data services and subscriptions. Training students, faculty and researchers in ways of effectively visualizing these data sources increases their use and utility. Finally, having data visualization skills within the library also comes with an operational advantage, allowing more effective sharing of data about the library.

We are the Visualizing the Future Symposia, an Institute of Museum and Library Services National Forum Grant-funded group created to develop instructional and research materials on data visualization for library professionals and a community of practice around data visualization. The grant was designed to address the lack of community around data visualization in libraries. More information about the grant is available at the Visualizing the Future website. While we have only included the names of the three main authors; this work was a product of the work of the entire cohort, which includes: Delores Carlito, David Christensen, Ryan Clement, Sally Gore, Tess Grynoch, Jo Klein, Dorothy Ogdon, Megan Ozeran, Alisa Rod, Andrzej Rutkowski, Cass Wilkinson Saldaña, Amy Sonnichsen, and Angela Zoss.

We are currently halfway through our grant work and, in addition to providing publicly available resources for teaching visualization, are also in the process of synthesizing and collecting shared insights into developing and providing data visualization instruction. This present article represents some of the key findings of our grant work.

Current Environment

In order to identify some broad data visualization needs and values, we reviewed three environmental scans. The first was carried out by Angela Zoss, who is one of the co-investigators on the grant, at Duke University (2018) based on a survey that received 36 responses from 30 separate institutions. The second, by S.K. Van Poolen (2017), focuses on an overview of the discipline and includes results from a survey of Big Ten Academic Alliance institutions and others. And the final report by Ilka Datig for Primary Research Group Inc (2019) provides a number of in-depth case studies. While none of the studies claim to provide an exhaustive list of every person or institution providing data visualization support in libraries, in combination they provide an effective overview of the state of the field.

Institutions

The combined environmental scans represent around thirty-five institutions, primarily academic libraries in the United States. However, the Zoss survey also includes data from the Australian National University, a number of Canadian universities, and the World Bank Group. The universities represented vary greatly in size and include large research institutions, such as the University of California Los Angeles, and small liberal arts schools, such as Middlebury and Carleton College.

Some appointments were full-time, while others reported visualization as a part of other job responsibilities. In the Zoss survey, roughly 33% of respondents reported the word “visualization” in their job title.

Types of activities

The combined scans include a variety of services and activities. According to the Zoss survey, the two most common activities (i.e. activities that the most respondents said they engaged in) were providing consultations on visualization projects and giving short workshops or lectures on data visualization. After that other services offered include: providing internal data visualization support for analyzing and communicating library data; training on visualization hardware and spaces (e.g. large scale visualization walls, 3D CAVEs); and managing such spaces and hardware.

Resources needed

These three environmental scans also collectively identify a number of resources that are critical for supporting data visualization in librarians. One of the key elements is training for new librarians, or librarians new to this type of work, on visualization itself and teaching/consulting on data visualization. They also mention that resources are required to effectively teach and support visualization software, including access to the software, learning materials, but also ample time is required for librarians to learn, create and experiment themselves so that they can be effective teachers. Finally they outline the need for communities of practice across institutions and shared resources to support visualization.

It’s About the People

In all of our work and research so far, one important element seems worth stressing and calling out on its own: It is the people who make data visualization services work. Even visualization services focused on advanced instructional spaces or immersive and large scale displays, require expertise to help patrons learn how to use the space, maintain and manage technology, schedule events to create interest, and, especially in the case of advanced spaces, create and manage content to suggest the possibilities. An example of this is the North Carolina State University Libraries’ Andrew W. Mellon Foundation-funded project “Immersive Scholar” (Vandegrift et al. 2018), which brought visiting artists to produce immersive artistic visualization projects in collaboration with staff for the large scale displays at the library.

We encourage any institution that is considering developing or expanding data visualization services to start by defining skill sets and services they wish to offer rather than the technology or infrastructure they intend to build. Some of these skills may include programming, data preparation, and designing for accessibility, which can support a broad range of services to meet user needs. Unsupported infrastructure (stale projects, broken technology, etc.) is a continuing problem in providing data visualization services, and starting any conversation around data visualization support by thinking about the people needed is crucial to creating sustainable, ethical, and useful services.

As evidenced by both the information in the environmental scans and the experiences of Visualizing the Future fellows, one of the most consistently important ways that libraries are supporting visualization is through consultations and workshops that span technologies from Excel to the latest virtual reality systems. Moreover, using these techniques and technologies effectively requires more than just technical know-how; it requires in-depth considerations of design aesthetics, sustainability, and the ethical use and re-use of data. Responsible and effective visualization design requires a variety of literacies (discussed below), critical consideration of where data comes from, and how best to represent data—all elements that are difficult to support and instruct without staff who have appropriate time and training.

Services

Data visualization services in libraries exist both internally and externally. Internally, data visualization is used for assessment (Murphy 2015), marketing librarians’ skills and demonstrating the value of libraries (Bouquin and Epstein 2015), collection analysis (Finch 2016), internal capacity building (Bouquin and Epstein 2015), and in other areas of libraries that primarily benefit the institution. 

External services, in contrast, support students, faculty, researchers, non-library staff, and community members. Some examples of services include individual consultations, workshops, creating spaces for data visualization (both physical and virtual), and providing support for tools. Some libraries extend visualization services into additional areas, like the New York University Health Sciences Library’s “Data Visualization Clinic,” which provides a space for attendees to share and receive feedback on their data visualizations from their peers (Zametkin and Rubin 2018), and the North Carolina State University Libraries’ Coffee and Viz Series, “a forum in which NC State researchers share their visualization work and discuss topics of interest” that is also open to the public (North Carolina State University Libraries 2015).

In order to offer these services, libraries need staff who have some interest and/or experience with data visualization. Some models include functional roles, such as data services librarians or data visualization librarians. These functional librarian roles ensure that the focus is on data and data visualization, and that there is dedicated, funded time available to work on data visualization learning and support. It is important to note that if there is a need for research data management support, it may require a position separate from data visualization. Data services are broad and needs can vary, so some assessment on the community’s greatest needs would help focus functional librarian positions. 

Functional librarian roles may lend themselves to external facing support and community building around data visualization outside of internal staff. A needs assessment can help identify user-centered services, outreach, and support that could help create a community around data visualization for students, faculty, researchers, non-library staff, and members of the public. Having a community focused on data visualization will make sure that services, spaces, and tools are utilized and meeting user needs. 

There is also room to develop non-librarian, technical data visualization positions, such as data visualization specialists or tool-specific specialist positions. These positions may not always have an outreach or community building focus and may be best suited for internal library data visualization support and production. Offering data visualization support as a service to users is separate from data visualization support as a part of library operations, and the decision on how to frame the positions can largely be determined by library needs. 

External data visualization services can include workshops, training sessions, consultations, and classroom instruction. These services can be focused on specific tools, such as Tableau, R, Gephi, and so on. They can be focused on particular skills, such as data cleaning and normalizing, dashboard design, and coding. They can also address general concerns, such as data visualization transparency and ethics, which may be folded into all of the services.

There are some challenges in determining which services to offer:

  • Is there an interest in data visualization in the community? This question should be answered before any services are offered to ensure services are utilized. If there are any liaison or outreach librarians at your institution, they may have deeper insight into user needs and connections to the leaders of their user groups.
  • Are there staff members who have dedicated time to effectively offer these services and support your users?
  • Is there funding for tools you want to teach?
  • Do you have a space to offer these services? This does not have to be anything more complicated than a room with a projector, but if these services begin to grow, it is important to consider the effectiveness of these services with a larger population. For example, a cap on the number of attendees for a tool-specific workshop might be needed to ensure the attendees receive enough individual support throughout the session.

If all of these areas are not addressed, there will be challenges in providing data visualization services and support. Successful data visualization services have adequate staffing, access to the required tools and data, space to offer services (not necessarily a data wall or makerspace, but simply a space with sufficient room to teach and collaborate), and community that is already interested and in need of data visualization services. 

Literacies

The skills that are necessary to provide good data visualization services are largely practical. We derive the following list from our collective experience, both as data visualization practitioners and as part of the Visualizing the Future community of practice. While the following list is not meant to be exhaustive, these are the core competencies that should be developed to offer data visualization services, either from an individual or as part of a team. 

A strong design sense: Without an understanding of how information is effectively conveyed, it is difficult to create or assess visualizations. Thus, data visualization experts need to be versed in the main principles of design (e.g. Gestalt, accessibility) and how to use these techniques to effectively communicate visual information.

Awareness of the ethical implications of data visualizations: Although the finer details are usually assessed on a case by case basis, a data visualization expert should be able to interpret when a visualization is misleading and have the agency to decline to create biased products. This is a critical part of enabling the practitioner to be an active partner in the creation of visualizations. 

An understanding, if not expertise, in a variety of visualization types: Network visualizations, maps, glyphs, Chernoff Faces, for example. There are many specialized forms of data visualization and no individual can be an expert in all of them, but a data visualization practitioner should at least be conversant in many of them. Although universal expertise is impractical, a working knowledge of when particular techniques should be used is a very important literacy.

A similar understanding of a variety of tools: Some examples include Tableau, PowerBI, Shiny, and Gephi. There are many different tools in current use for creating static graphics and interactive dashboards. Again, universal expertise is impractical, but a competent practitioner should be aware of the tools available and capable of making recommendations outside their expertise.

Familiarity with one or more coding languages: Many complex data visualizations happen at the command line (at least partially) so there is a need for an effective practitioner to be at least familiar with the languages most commonly used (likely either R or Python). Not every data visualization expert needs to be a programmer, but familiarity with the potential for these tools is necessary.

Conclusion

The challenges inherent in building and providing data visualization instruction in academic libraries provide an opportunity to address larger pedagogical issues, especially around emerging technologies, methods, and roles in libraries and beyond. In public library settings, the needs for services may be even greater, with patrons unable to find accessible training sources when they need to analyze, assess, and work with diverse types of data and tools. While the focus of our grant work has been on data visualization, the findings reflect the general difficulties of balancing the need and desire to teach tools and invest in infrastructure with the value of teaching concepts and investing in individuals. It is imperative that work teaching and supporting emerging technologies and methods focus on supporting the people and the development of literacies rather than just teaching the use of specific tools. To do so requires the creation of spaces and networks to share information and discoveries.

Bibliography

Bouquin, Daina and Helen-Ann Brown Epstein. 2015. “Teaching Data Visualization Basics to Market the Value of a Hospital Library: An Infographic as One Example.” Journal of Hospital Librarianship 15, no. 4: 349–364. https://doi.org/10.1080/15323269.2015.1079686.

Datig, Ilka. 2019. Profiles of Academic Library Use of Data Visualization Applications. New York: Primary Research Group Inc.

Finch, Jannette L. and Angela R. Flenner. 2016. “Using Data Visualization to Examine an Academic Library Collection.” College & Research Libraries 77, no. 6: 765–778. https://doi.org/10.5860/crl.77.6.765.

Micah Vandegrift, Shelby Hallman, Walt Gurley, Mildred Nicaragua, Abigail Mann, Mike Nutt, Markus Wust, Greg Raschke, Erica Hayes, Abigail Feldman Cynthia Rosenfeld, Jasmine Lang, David Reagan, Eric Johnson, Chris Hoffman, Alexandra Perkins, Patrick Rashleigh, Robert Wallace, William Mischo, and Elisandro Cabada. 2018. Immersive Scholar. Released on GitHub and Open Science Framework. https://osf.io/3z7k5/.

LaPolla, Fred Willie Zametkin and Denis Rubin. 2018. “The “Data Visualization Clinic”: a library-led critique workshop for data visualization.” Journal of the Medical Library Association 106, no. 4: 477–482. https://doi.org/10.5195/jmla.2018.333.

Murphy, Sarah Anne. 2015. “How data visualization supports academic library assessment.” College & Research Libraries News 76, no. 9: 482–486. https://doi.org/10.5860/crln.76.9.9379.

North Carolina State University Libraries. “Coffee & Viz.” Accessed December 4, 2019. https://www.lib.ncsu.edu/news/coffee–viz

Van Poolen, S.K. 2017. “Data Visualization: Study & Survey.” Practicum study at the University of Illinois. 

Zoss, Angela. 2018. “Visualization Librarian Census.” TRLN Data Blog. Last modified June 16, 2018. https://trln.github.io/data-blog/data%20visualization/survey/visualization-librarian-census/.

About the Authors

Negeen Aghassibake is the Data Visualization Librarian at the University of Washington Libraries. Her goal is to help library users think critically about data visualization and how it might play a role in their work. Negeen holds an MS in Information Studies from the University of Texas at Austin.

Matthew Sisk is a spatial data specialist and Geographic Information Systems Librarian based in Notre Dame’s Navari Family Center for Digital Scholarship. He received his PhD in Paleolithic Archaeology from Stony Brook University in 2011 and has worked extensively in GIS-based archaeology and ecological modeling.  His research focuses on human-environment interactions, the spatial scale environmental toxins and community-based research.

Justin Joque is the Visualization Librarian at the University of Michigan. He completed his PhD in Communications and Media Studies at the European Graduate School and holds a Master of Science in Information (MIS) from the University of Michigan.


A screenshot of a highlighted section of the research essay; students’ annotations comment on the driving question and data collection in a word processor.
1

Visualizing Essay Elements: A Color-Coding Approach to Teaching First-year Writing

Ruth Li

In this piece, the author shares a strategy for teaching first-year writing in which students color-code and annotate sample rhetorical analysis and research-based essays for elements including citations, quotations, transition words, vocabulary, and structure.

Read more… Visualizing Essay Elements: A Color-Coding Approach to Teaching First-year Writing

Skip to toolbar